Every warehouse has sprinklers. Very few warehouse operators can confidently answer three basic questions:
-
What hazard was this system designed for?
-
Does that still match what we actually store and how we store it today?
-
If we had a fire tonight, would the system be expected to control it—or are we counting on luck?
If you store more plastics, go higher in the racks, or push into colder parts of the building without revisiting the design basis, you can end up with a system that looks compliant but is unlikely to control a real fire. That gap shows up later as larger losses, tougher insurance conversations, and expensive retrofit projects.
This article breaks down how warehouse sprinkler systems are really designed, where tenants unintentionally outgrow their protection, and what data you should capture for every building in your network

Sprinkler Systems Are Engineered For Use
Sprinkler systems are not “good” or “bad” in the abstract. They are designed around specific assumptions:
-
What you store (commodity and packaging)
-
How you store it (height, racking, flue spaces, aisles)
-
The type of system and water supply (wet, dry, ESFR, in‑rack, etc.)
Change those assumptions enough, and you can end up with a system that looks fine on paper but is under‑designed for a real fire in your current operation.
For tenants, that means:
-
A roof full of sprinklers does not equal “covered.”
-
You need to know what the design basis was and how far you have moved away from it.
Commodity And Storage Height: The Real Starting Point For Sprinkler Design
Sprinkler design in warehouses starts with commodity classification and storage height, not with the brand of sprinkler head.

At a simplified level:
-
Lower‑hazard commodities: Paper, wood, textiles with limited plastic packaging, stored at moderate heights.
-
Higher‑hazard commodities: Consumer goods with significant plastic content, foam, and complex packaging, especially when stored in tall racks.
Every time you change:
-
The product mix (more plastic, more packaged goods, more flammables)
-
The way you store it (higher racks, denser storage, different packaging)
…you are potentially stepping outside the assumptions your system was designed to handle.
Practical takeaway:
You should be able to answer, for each building:
-
What commodity class was used in the original sprinkler design?
-
What is our current commodity and packaging mix?
-
What is our maximum storage height today vs. what the system was designed for?
If those answers do not align, you have a risk flag—whether or not anyone has written you up yet.

Warehouse Sprinkler System Types And What They Are Actually Good For
Most tenants know the wet vs dry distinction. But from a risk standpoint, the more important question is: Is the system type appropriate for my hazard, height, and climate? Here is a concise way to frame it.
Wet Pipe Sprinkler Systems: The Standard Workhorse
-
Pipes are filled with water; when a head opens, water flows immediately.
-
Great for heated spaces and many “ordinary hazard” or moderate‑height storage uses.
Things to watch:
-
Not acceptable in areas that can freeze.
-
May need higher densities or different configurations for tall, plastic‑rich storage.
Dry Pipe Sprinkler Systems: When Freezing Is An Issue
-
Pipes are filled with air; water arrives after a short delay when a head opens.
-
Common in loading docks, unheated sections, and some cold‑storage zones.
Things to watch:
-
More complexity and maintenance.
-
The built‑in delay matters more as the hazard and storage height go up—often leading to a need for in‑rack sprinklers or specialty designs.
ESFR Sprinklers: Built For High‑Piled Storage
-
Early Suppression, Fast Response (ESFR) sprinklers are designed to suppress fires in high‑piled storage, not just control them.
-
Often used for higher storage heights and more challenging commodities, with specific rules on flue spaces and obstructions.
Things to watch:
-
ESFR is sensitive to obstructions (ducts, lights, structural members) and storage layout.
-
“Minor” changes in racking or adding equipment in the ceiling can quietly undermine performance.
In‑Rack, Foam, And Special Hazard Sprinkler Systems
-
In‑rack sprinklers come into play when ceiling‑only protection is not enough for very tall or very challenging storage.
-
Foam or special systems may be needed when you store significant flammable or combustible liquids, or have unusual hazards.
Things to watch:
-
These systems are often tied to very specific design assumptions and maintenance requirements.
-
If you repurpose a building without checking those assumptions, you may inherit a system that is wrong for your new use.
Three Ways Tenants Typically Outgrow Their Warehouse Sprinklers
Across portfolios, the same patterns show up again and again. Most tenants do not deliberately cut corners; they simply expand and evolve faster than the fire protection design.
Pattern 1: Storage Height Creep In Warehouses
-
Racks go higher to gain capacity.
-
Mezzanines or extra levels are added over time.
If those changes push you beyond the design tables used for the original system, you may need higher densities, ESFR, or in‑rack protection. Without that, the system may never have had a realistic chance of controlling a worst‑case fire.
Pattern 2: More Plastics And Different Packaging
-
Product lines shift toward more plastic‑heavy consumer goods, foam, or complex packaging.
-
Pallet patterns and packaging practices change, often increasing exposed plastic surface.
The fire load increases, sometimes dramatically, but the system still assumes a lower commodity class.
Pattern 3: Cold Storage And Marginal Temperatures
-
Portions of a building run near freezing, or are converted to refrigerated use after the fact.
-
Wet systems are exposed to freezing risk, or dry systems are extended into areas they were not originally designed for.
The result can be pipes that freeze and fail, or delayed water delivery in precisely the areas you can least afford it.
Essential Sprinkler Data Every Warehouse Tenant Should Capture
You do not need to run hydraulic calculations. But if you operate multiple warehouses, there are a few pieces of information you should standardize across all sites.
For each location, capture:
-
System Type: Wet, dry, ESFR, in‑rack, pre‑action, foam, etc.
-
Design Basis Snapshot:
-
Commodity class used in design
-
Maximum storage height assumed
-
Any special notes (for example, “ceiling‑only ESFR for Class I–IV up to X ft”)
-
Current Operation:
-
Actual commodity mix and highest‑hazard items
-
Actual max storage height and racking layout
-
Inspection & Maintenance Status:
-
Dates and outcomes of recent inspections and tests
-
Known deficiencies or open findings
Once you have this information, even in a simple consistent template, you can:
-
Spot where your use has outrun your design basis.
-
Prioritize which facilities need engineering review or upgrades.
-
Make better decisions about renewals, expansions, and consolidations.

How To Use Sprinkler Data In Real Warehouse Lease Decisions
Here are a few practical ways sophisticated tenants use sprinkler data to make better calls.
Before Signing A Warehouse Lease
-
Ask for the fire protection drawings and a brief design narrative.
-
Confirm the system was designed for something close to your planned commodities and storage heights.
-
If not, quantify what upgrades or changes would be needed—and either negotiate or walk.
Before Changing What You Store Or How You Store It
-
Treat significant changes in commodity mix or storage height as triggers for a fire protection review, not just an operations decision.
-
Ask, “What did we tell the engineer or landlord when this system was designed, and how is today different?”
At Renewal, Expansion, Or Consolidation
-
Put sprinkler system adequacy on the same checklist as rent, TI, and location.
-
If a building’s system is marginal for your current or future use, factor upgrade cost, downtime, and insurance impact into the comparison.
Where Warehouse Portfolio Software Quietly Helps
Once you spread this thinking across a portfolio, the challenge is not understanding the concepts—it is keeping track of the details for 10, 50, or 500 buildings.
Portfolio and transaction management software can help by:
-
Giving you a standard way to record the sprinkler design basis and current use for each site.
-
Letting you quickly filter for mismatches (for example, high‑piled plastics in buildings without appropriate protection).
-
Putting that information in front of you when you are making lease and network decisions, instead of buried in old drawings.
When you are ready to move beyond one‑off sprinkler checks and spreadsheets, REoptimizer® gives you the portfolio view you are missing. It centralizes lease, building, and fire‑protection data by site so you can see, in seconds, where your storage has outgrown the original design—and act before it becomes a costly problem.
If you want to know which warehouses in your network have the biggest mismatch between what you store and how you are protected, request a REoptimizer® demo and map your sprinkler risk across your entire portfolio in one place.
Request a Demo
As we move through the first quarter of 2026, the Nashville industrial market report reveals a landscape defined by record-breaking rents, plummeting construction starts, and a sophisticated “flight to quality” that is reshaping how companies approach warehouse space.
Now, it has become impossible to overlook the structural shift occurring in Middle Tennessee.
What was once a localized surge in industrial sector demand has matured into a national anomaly: Nashville has officially solidified its position as the #2 tightest industrial market in the United States, trailing only Omaha. For corporate executives, the “Music City” narrative is no longer about expansion potential—it is about scarcity management.
Nashville Industrial Market Report: The Data
The latest Q4 2025 and early 2026 figures reveal a market that is running so hot that it’s wearing out its supply of high-quality inventory.
While national vacancy rates have stabilized around 7.1%, Nashville is operating in a different stratosphere.
The Second Tightest Market for Industrial Space in the US
- The Demand Surge: Net absorption in Q4 2025 hit 778,940 square feet, a staggering 71.5% increase from the previous quarter.
- The Vacancy Floor: Nashville’s vacancy rate dropped to 4.2% in January 2026—a 6-basis-point decrease during a period when most markets saw supply-side softening.
- The Rent Ceiling: Direct asking rents for nashville industrial assets reached a record $10.30 per square foot (NNN), with “small-bay” facilities under 100,000 sq. ft. often commanding $14.00/SF.
- The Construction Cliff: New project starts have cratered to their lowest levels since 2017. Currently, only 3.8 million square feet is under construction—less than 40% of the volume seen just two years ago.

Executive Insights: Why Nashville Industrial is Leading the Nation
Corporate occupiers are no longer just competing for space; they are competing for modernity. The “flight to quality” has become a mandatory capital expenditure for operational survival. Lets look deeper into these key trends:
1. The Premium for Modern Warehouse Space
Properties built since 2015 are absorbing industrial space at 16.9 times the rate of second-generation assets. If your warehouse footprint consists of legacy assets (pre-2015), you are likely paying for “dead space” that cannot support the power loads or 36’+ clear heights required for modern AI-driven automation and robotics.
2. The Logistics Goldmine
Nashville’s extensive highway network allows businesses to reach 50% of the U.S. population within a one-day drive. This geographic advantage is the primary driver for expansions by major players like Amazon, Oracle, and Nissan. In a 2026 economy where shipping speed equals market share, industrial real estate in Nashville is a strategic weapon, not just a line-item expense. Logistics facilities in Nashville are well positioned, whether for midwest markets or beyond.
3. Small-Bay Scarcity
Buildings under 100,000 sq. ft. represent the tightest segment of the industrial market, accounting for over 80% of current leasing activity. For tenants with diverse portfolios including office and warehouse needs, the “flex” product class is effectively 100% leased in prime submarkets like Interchange City.

Strategic Challenges: The 2026 “Supply Squeeze”
For the first time in this cycle, the rate of change in supply has turned negative. Active listings are decreasing, permit lags are mounting, and infrastructure constraints—specifically access to reliable high-voltage power—are emerging as the new gatekeepers of development.
- Shortened Lease Terms: Average lease terms have compressed by 16 months compared to pre-pandemic norms. Tenants want flexibility, but in a 4.2% vacancy market, this flexibility comes with a massive “market-to-market” rent risk at renewal.
- Concession Erasure: Tenant Improvement (TI) allowances and free rent periods have vanished for prime industrial space. Landlords are now dictating terms, often requiring CPI-linked escalations that exceed the traditional 3% standard.
Playing Offense in a Landlord’s Market
In a market where average lease terms have shortened by 16 months to hedge against volatility, “reactive” management is a recipe for budget blowouts. Landlord leverage is at an all-time high, and standard concessions like free rent or generous TI packages have virtually vanished.
- Audit for Underperformance: Identify assets where your rent-per-square-foot is delivering a negative ROI on labor and power access.
- Secure the Pipeline: With starts plummeting, the speculative supply for 2027 doesn’t exist. New deliveries are limited. You must initiate renewals or new site selections 18–24 months in advance.
- Demand Data Transparency: In a market where rents are jumping 12% annually, you cannot afford to manage by intuition.
Take Control with REoptimizer®
In a “constrained and resilient” market like Nashville, you cannot rely on landlord-biased data or manual spreadsheets. You need a single source of truth to manage your entire portfolio of office and industrial real estate.
REoptimizer® is the only transaction management software designed exclusively for the corporate tenant. We provide the tools you need to out-negotiate a tightening market:
- Market Benchmarking: Instantly compare your current nashville industrial spend against the new $11.32/SF submarket highs to identify over-market liabilities.
- Key Site Drivers™: Rank your locations by what actually moves the needle: power availability, dock ratios, and labor proximity—not just the base rent.
- Deadline Automation: Never miss a critical renewal window. In a supply-starved market, missing a 12-month notice period can mean a forced relocation or a 20% rent hike.
- Conflict-Free Advocacy: Our True Tenant Rep™ philosophy ensures that your interests—and only your interests—are represented in every deal.
Nashville’s industrial market is moving at light speed. Schedule a Free Portfolio Analysis with REoptimizer® today and discover how to save 30% on your CRE costs while reclaiming 90% of your time.
Stop reacting to the market. Start optimizing it.
Book a Demo
Nashville Industrial Market Report: 2026 Executive FAQ
This section breaks down the critical data from the Q1 2026 Nashville industrial market report to help corporate tenants and portfolio managers navigate the most supply-constrained industrial sector in the Southeast.
1. What is the current status of Nashville’s industrial market in 2026?
Nashville has officially transitioned into a “landlord-dominant” phase. As of January 2026, it is the #2 tightest industrial market in the United States. While national vacancy averages hover near 7.1%, Nashville’s industrial market remains resiliently low at 4.2%–4.5%. This is driven by high demand from the e-commerce, automotive, and manufacturing sectors.
2. How much does warehouse space cost in Nashville today?
Direct asking rent has reached a historic high of $10.30 per square foot ($110.87 per square meter in metric units). However, there is a significant price bifurcation based on the size of the industrial real estate:
- Small-Bay Industrial (<50,000 sq. ft.): These units command premiums of $13.50–$14.00 per square foot.
- Bulk Distribution Centers (>250,000 sq. ft.): Rates currently range between $9.50 and $10.50 per square foot.
- Flex Properties: In high-demand submarkets like the Industrial CBD, weighted average rents are hitting $11.32 per square foot.
3. What are the key trends regarding new deliveries and construction?
The “supply cliff” is the defining narrative of 2026. After a multi-year boom, new deliveries have slowed to a trickle.
- Construction Pipeline: There is currently only 2.9–3.4 million square feet under active construction—a 40% drop from the 5-year average of 7.3 million square feet.
- Pre-leasing: Over 36% of the space delivered in the most recent quarter was pre-leased before completion, leaving very little “plug-and-play” industrial space for incoming businesses.
4. Which submarkets are the most constrained for industrial space?
Location is everything in Tennessee. The North submarket is the tightest in the region, with vacancy dropping to a razor-thin 2.6%. Meanwhile, Southeast Nashville and Wilson County remain the largest hubs for distribution, but they are also seeing some of the most aggressive rent growth, climbing nearly 27% annually in some sectors.
5. How does Nashville International Airport (BNA) factor into logistics operations?
Nashville International Airport is a critical hub for time-sensitive operations. BNA is currently undergoing a multi-billion dollar expansion program (New Horizon), including a North Cargo Apron Reconstruction scheduled for completion in FY26. These logistics facilities are well positioned to support companies reaching both Midwest markets and the broader Southeast within a one-day drive.
6. How does Nashville compare to Memphis for distribution centers?
While Memphis remains the global “Logistics Capital” due to the FedEx SuperHub, Nashville is winning the “Flight to Quality.”
- Nashville: Higher cost but superior access to a high-tech labor pool and a booming commercial real estate market.
- Memphis: Offers more available square footage and lower base rents, but lacks Nashville’s diverse manufacturing and tech growth.
7. What is the best way to find and lease industrial properties in this market?
With limited listings and high competition, a standard search is no longer enough. Understanding the market requires a conflict-free analysis.
- Action: Large-scale distribution users should contact a specialist to audit their current lease terms.
- Optimization: Using a platform like REoptimizer® allows you to toggle between metric and imperial measurements for global reporting, zoom in on site-specific drivers, and jump ahead of renewal deadlines to maintain leverage.
After decades of optimizing global supply chains around lower labor costs and offshore outsourcing, companies are entering a new phase of industrial strategy. The shift underway is not ideological and it is not nostalgic. It is pragmatic.
Onshoring—bringing manufacturing operations and critical services back into the same country—is gaining traction as companies reassess risk, cost structures, and operational control in a world defined by volatility. For corporate tenants, this shift is no longer abstract. It is reshaping industrial, warehouse, and manufacturing leasing decisions in real time.
The question facing many companies is no longer whether onshoring makes sense, but how to execute it without eroding competitiveness amid higher labor costs, rising production costs, and tightening real estate constraints.

Onshoring and the Shift from Global Supply Chains
The modern onshoring movement is being driven by several converging forces:
- Supply chain disruptions exposed the fragility of distant suppliers and just-in-time models
- Geopolitical tensions and tariffs increased the cost and unpredictability of offshore production
- Rising labor costs in developing countries narrowed historical labor savings
- Customer demands and consumer preferences increasingly favor faster delivery, transparency, and domestically produced goods
- Policy incentives such as CHIPS, IRA, and state-level programs materially changed investment math
As a result, many companies are rebalancing global manufacturing strategies. This does not mean abandoning global supply chains entirely. It means regionalizing production processes, shortening supply lines, and diversifying risk.
Onshoring and nearshoring—often to neighboring countries like Mexico or Central America—are now viewed as attractive alternatives to purely offshore models.
Manufacturing Demand Is Translating Into Real Estate Pressure
The onshoring narrative becomes tangible when it hits real estate.
Industrial demand tied to manufacturing has risen sharply. Manufacturing now accounts for nearly one-fifth of total industrial leasing activity, and projections suggest continued growth through the latter half of the decade.
Large capital commitments—from pharmaceutical, semiconductor, consumer goods, and advanced manufacturing firms—are adding millions of square feet to the domestic industrial footprint.
But this demand is not evenly distributed.
Corporate tenants are discovering that onshored production requires different buildings in different places, with different constraints:
- Smaller, more automated production facilities
- Higher power density and grid reliability
- Proximity to domestic markets and transportation corridors
- Zoning compatibility with advanced manufacturing and logistics
- Access to skilled workers within tight labor markets
For warehouse and industrial occupiers, onshoring does not just create demand for factories. It expands demand for supplier facilities, distribution centers, cross-dock operations, and service providers, often clustered within a few hundred miles.

Utilization Is Rising And Slack Is Disappearing
One of the most important signals for corporate tenants is utilization.
U.S. warehouse utilization is climbing steadily, led by manufacturing, e-commerce, and essential goods users. While headline vacancy rates may appear manageable, functional slack is shrinking, particularly in markets with strong infrastructure, labor availability, and power access.
Historically, when utilization rebounds after a period of excess capacity, markets tighten quickly. If current trends hold, many occupiers will find themselves competing for space sooner than expected.
For tenants, this creates urgency:
- Sites once considered “backup capacity” may be difficult or expensive to replace
- Delayed site selection decisions increase exposure to rent escalation and power constraints
- Expansion optionality is becoming as valuable as initial lease economics
Higher Labor Costs for Better Quality Control
The question everyone asking though is how onshoring affects cost strategy. The honest answer is nuanced.
Onshoring typically results in higher labor costs and higher production costs compared to offshore outsourcing. Domestic labor markets are tighter, wage expectations are higher, and regulatory compliance can increase expenses.
However, companies are increasingly evaluating total cost of ownership, not just unit labor cost.
Onshoring can:
- Reduce transportation and shipping costs
- Shorten lead times and improve operational efficiency
- Improve quality control and quality assurance through direct oversight
- Enhance intellectual property protection and data security
- Reduce exposure to supply chain disruptions and materials shortages
For many companies, the ability to mitigate risk, protect brand reputation, and respond quickly to market demands offsets higher nominal costs.
This is why onshoring is best understood as risk management, not cost arbitrage.

Power And Infrastructure Are Now Gating Factors
Location strategy for industrial real estate has fundamentally changed.
In 2026, power availability is no longer a secondary consideration. Automated manufacturing and high-throughput logistics facilities can require three to five times more power than prior-generation buildings. In many markets, grid capacity—not land or rent—is the limiting factor.
Corporate tenants must now evaluate:
- Existing electrical capacity and upgrade timelines
- Substation proximity and reliability
- Utility pricing volatility
- Broadband and data infrastructure
- Transportation access amid rising trucking costs
Markets that can guarantee uptime and scalability will command premium rents. Older industrial buildings with strong “bones”—heavy utilities, high floor loads, and favorable zoning—are being re-rated upward.
Workforce And Time Zone Advantages Matter More Than Ever
Onshoring also reshapes workforce strategy.
While some companies worry about access to specialized skills, others see advantages in operating within the same time zone, under local regulations, and with closer alignment between business operations and labor force availability.
Challenged Labor Market
That said, labor remains a constraint. Many onshoring companies report difficulty staffing new facilities quickly, especially for advanced manufacturing roles. This has elevated the importance of:
- Workforce development partnerships
- Community college and technical training pipelines
- Location selection that balances labor availability with cost

What This Means For Corporate Tenants And CRE Strategy
The industrial real estate market is not collapsing, and it is not overheating. It is tightening, re-sorting, and repricing around performance.
For corporate tenants, this creates several imperatives:
- Continuously monitor portfolio utilization, not just lease expirations
- Re-run network optimization models using updated assumptions for transportation costs, power, and labor
- Treat site selection as an ongoing process, not a one-time transaction
- Understand competitive demand beyond your own industry, including defense, advanced manufacturing, and e-commerce
The companies navigating this environment most effectively are those that treat logistics and industrial real estate as a strategic lever, not a back-office function.
Turning Insight Into Action
In a market defined by higher costs, tighter constraints, and faster change, static planning is a liability.
Corporate tenants need tools that allow them to:
- Monitor real-time utilization and portfolio risk
- Model onshoring and nearshoring scenarios across markets
- Identify optimal site selection options using layered data—traffic, infrastructure, labor, power, and cost
- Stress-test decisions against future transportation and supply chain disruptions
This is where platforms like REOptimizer® play a growing role. By combining portfolio intelligence with tools like CREsiteiq for mapping and site analysis, tenants gain visibility into how their current footprint performs—and where future opportunities or risks are emerging.
In an era where onshoring decisions directly affect real estate strategy, the ability to see, model, and adapt faster than competitors is becoming a competitive advantage. Request a demo to see how REOptimizer® can strategize your industrial portfolio like never before.
Book a Demo
The Bottom Line
Onshoring is not a temporary reaction. It is a structural shift shaped by risk, resilience, and realism.
For warehouse, industrial, and manufacturing tenants, the implications are clear:
- Space matters more
- Location matters differently
- Power, labor, and transportation matter earlier
- And decisions made today will define flexibility tomorrow
The companies that succeed will not be those chasing the lowest cost, but those optimizing for control, continuity, and performance in an uncertain world.
Frequently Asked Questions About Onshoring And Industrial Real Estate
What Is Onshoring In Business Operations?
Onshoring refers to the practice of relocating business operations—such as manufacturing operations, services, or production processes—within a company’s own country rather than outsourcing them to a foreign country. Companies pursue onshoring to improve quality control, reduce supply chain disruptions, protect intellectual property, and operate within the same regulatory and time zone environment.
What Are The Main Advantages Of Onshoring?
The primary advantages of onshoring include improved quality control, stronger supply chain resilience, reduced reliance on distant suppliers, and faster response to customer demands. Onshoring also enhances brand reputation by demonstrating commitment to the local economy and can improve data security and intellectual property protection through closer oversight of business operations.
What Are The Disadvantages Of Onshoring?
Onshoring can result in higher labor costs and higher production costs compared to offshore outsourcing, particularly in tight domestic labor markets. Companies may also face talent shortages if skilled workers are limited locally, and upfront investment in production facilities, automation, and workforce training can be significant.
Does Onshoring Reduce Transportation And Shipping Costs?
Onshoring can reduce transportation and shipping costs by shortening distances between production facilities, warehouses, and end consumers. While domestic logistics costs may still rise due to trucking constraints, companies often benefit from lower exposure to global freight volatility, port congestion, and long lead-time disruptions.
How Does Onshoring Improve Supply Chain Resilience?
Onshoring improves supply chain management by reducing dependence on global supply chains and offshore workers in distant regions. By operating closer to the domestic market, companies can mitigate risk from geopolitical tensions, tariffs, materials shortages, and international logistics disruptions while maintaining greater control over production schedules and inventory.
How Is Onshoring Impacting Industrial And Warehouse Leasing?
Onshoring is increasing demand for industrial, warehouse, and manufacturing leasing—particularly for power-ready, automation-capable facilities near major transportation corridors and population centers. Corporate tenants are competing for well-located industrial properties that support modern production processes, supplier adjacency, and efficient distribution networks.
How Does Onshoring Compare To Offshoring And Nearshoring?
Offshoring involves relocating operations to other countries, often to capture lower labor costs. Nearshoring moves operations to neighboring countries, such as Mexico or Central America, to balance cost savings with reduced risk. Onshoring keeps operations within the same country, prioritizing control, quality assurance, regulatory certainty, and proximity to the domestic marketplace—often at higher nominal costs but lower risk.
Which Industries Benefit Most From Onshoring?
Manufacturing, advanced technology, healthcare, financial institutions, defense-related industries, and certain customer service functions benefit most from onshoring. These sectors value quality control, data security, compliance with local regulations, and faster response times to market demands, making domestic operations strategically attractive.
Is Onshoring A Long-Term Trend Or A Short-Term Reaction?
While near-term activity can fluctuate due to political uncertainty and pricing pressures, onshoring is widely viewed as a long-term structural shift. Ongoing geopolitical risk, rising labor costs in developing countries, and the need for resilient supply chains suggest that many companies will continue bringing production and services closer to home over time.
How Can Corporate Tenants Evaluate Onshoring And Site Selection Decisions?
Corporate tenants should evaluate onshoring decisions using total cost of occupancy rather than rent alone. This includes labor costs, transportation costs, power availability, operational efficiency, and supply chain risk. Platforms like REoptimizer®, combined with tools such as CRESiteIQ™, help tenants analyze their current portfolio, compare site selection options, and monitor location-specific factors like traffic, infrastructure, and market dynamics.
In a year that once again tested expectations across commercial real estate, 2025 emerged not as a dramatic turnaround story but as a strategic inflection point—particularly for office and industrial sectors.
For corporate tenants and CRE teams navigating hybrid work, supply chain shifts, and capital market stress, the data tell a clear story: performance now hinges on precision, not prediction.
1. Office Market: Stabilizing — But Still Reshaping Demand
After years of pandemic-era contraction, the U.S. office market showed meaningful signs of stabilization in 2025—even if the recovery remains uneven and deeply contextual.
Attendance Patterns Point to Growing Stability
Office traffic has steadily climbed throughout the year, with national office attendance approaching 72.6% of pre-COVID levels in 2025 according to foot-traffic analytics. This marks a dramatic increase from the pandemic troughs and represents one of the strongest rebounds since 2020.

These attendance gains have real economic implications. Not only do they support stabilization in rental dynamics and tenant confidence, but they also provide the workforce presence necessary to justify continued investment in office space, amenities, and hybrid collaboration zones.
Additionally, the proportion of corporations actively tracking attendance jumped to 69%, reflecting a growing recognition that employee attendance data are not just operational but strategic for measuring impact on productivity, utilization, and tenant experience.
Vacancy Remains High, But Market Fundamentals Are Improving
Office vacancy, though elevated compared to historical norms, edged slightly lower in 2025. National vacancy hovered around 18.6% in late 2025, a modest dive relative to the record highs it experienced through 2023–24.
In major gateway markets like New York City, vacancy pressure is easing. Moody’s data show that while vacancy rates remain above long-term averages, net absorption turned marginally positive in 2025, a sign that employers with clear hybrid strategies are contributing to localized demand growth.
Meanwhile, leasing activity in key submarkets underscored renewed confidence. Downtown Manhattan saw vacancy fall to 23% with average asking rents rising by over 3% year-over-year—a strong performance relative to broader national trends.
Flight to Quality Persists
Vacancy is no longer a single market condition—it’s a two-tier outcome tied to asset quality. And the 18.6% average vacancy can be misleading when we look at it as a whole. The more important story for occupiers is the duality inside that number.
The office market isn’t recovering uniformly; it’s splitting by asset quality and by submarket, creating a widening performance gap between buildings that can win talent back (and justify on-site days) and those that can’t.
Across major markets, leasing activity continues to tilt toward Trophy/Class A, while Class B/C’s share shrinks—a pattern that effectively pulls fundamentals upward for the best assets while leaving commodity stock behind.
Manhattan is one of the clearest examples of this duality: Trophy properties captured 61.6% of Manhattan leasing activity in Q1 2025 (by class), an unusually concentrated signal that tenants are choosing “best-in-market” space even when overall demand is still recovering.
Why This Matters For Corporate Tenants
Flight to quality is often framed as a landlord story. For occupiers, it’s a portfolio performance lever:
- Trophy/Class A is becoming the “utilization bet.” If your workplace strategy relies on consistent in-office patterns to drive collaboration and culture, premium assets increasingly act like the infrastructure that makes that behavior easier to sustain.
- Class B/C is becoming a repositioning / pricing bet. There can be value, but the underwriting has to assume higher volatility and larger gaps between “leased” and “used” space—plus greater reliance on concessions and landlord capex to stay relevant. (This is why conversion/repositioning talk keeps rising in market reports.) Not to mention a lot of these assets are being phased out of the market completely as conversions take shape.

2. Industrial: Continued Demand, With Nuanced Supply Dynamics
Industrial real estate sustained its long run of relative strength in 2025, even as supply and demand shifted toward equilibrium.
Long-Term Occupancy Growth Is Unbroken
Industrial tenant demand remained positive for the 60th consecutive quarter, a streak that now spans nearly 15 years—a testament to structural drivers such as e-commerce logistics and manufacturing rebalancing.
However, industrial vacancy did tick higher, reaching around 7.3% in Q2 2025, as move-outs and completions both contributed to slight softening.
Rent Growth Moderates, but Demand Diversity Expands
Industrial rent growth softened compared to the rapid gains of the pandemic era.
That said, diversification within the sector—especially toward cold storage, last-mile logistics, and automation-ready assets—continues to support strategic leasing and long-term tenant retention.
For tenants, this trend underscores the increasing importance of site selection analytics that match inventory with evolving supply chain footprints rather than broad assumptions of generalized growth.
The Construction Pipeline: Why Rent Growth Didn’t Collapse
That demand diversification is landing at the exact moment the industrial pipeline is drying up—which is a big reason rent growth moderated instead of falling off a cliff.
- Space under construction fell ~61% from the 2022 peak, dropping to ~279M SF in Q1 2025, with forecasts calling for the pipeline to dip below 250M SF by year-end.
- At the start of 2025, nationwide industrial construction was already down ~25% year-over-year, signaling a clear pullback in new supply.
The supply picture also explains the “two-speed” industrial market corporate tenants are feeling: vacancy rose to ~7.1% nationally in Q2 2025, yet small warehouses (<100K SF) stayed tight at ~4.4% vacancy—exactly the segment most aligned with last-mile and serviceable infill demand.
Net: 2025’s pipeline reset is quietly supporting pricing power in the right product types—especially smaller, well-located, higher-spec space—while pushing tenants toward sharper site selection analytics to avoid being trapped between soft big-box supply and scarce infill options.
3. Capital Markets and CRE Valuations: Discipline and Divergence
2025’s capital markets landscape accentuated a central reality: value is emerging at the intersection of risk management and operational data.
- Persistent headwinds in office valuations continued, with commercial property values still well below pre-pandemic levels in many categories.
- Conversely, industrial and select retail assets maintained relative valuation resilience due to consistent demand fundamentals and niche structural drivers.
For CRE teams, this divergence is a reminder that portfolio performance is not monolithic. Markets like Sun Belt logistics hubs and high-amenity urban cores are commanding differentiated risk premiums based on robust utilization and tenant demand clarity.

4. CRE Tech & Analytics: A Strategic Imperative
Perhaps the most pervasive trend of 2025 is the integration of advanced analytics, automation, and real-time occupancy intelligence into every layer of CRE decision-making.
From attendance tracking that informs space allocation and workplace strategy to predictive models that anticipate lease expirations and submarket pricing shifts, CRE technology is now a core operational competency—not a novelty.
This evolution reflects a broader shift from reactive portfolio maintenance to strategic portfolio optimization powered by reliable, real-time data.
And no where is the promise of real time data more profonde than the emergence of AI. It’s really the elephant in the room when we talk about the trends that have taken shape in 2025.
A Global Real Estate Technology Survey captures the moment bluntly: ~90% of organizations are piloting AI, yet only ~5% report achieving all (or most) of their AI goals—a gap that signals both massive momentum and a lot of wasted spend if the data foundation isn’t ready.

What AI Changes For Corporate Tenants And CRE Teams
AI isn’t just making reporting faster. It’s starting to rewire how portfolios are run:
- From static planning to continuous optimization: AI-enabled platforms can blend utilization, lease terms, operating costs, and market data to surface opportunities in near-real time (not quarterly).
- From “attendance” to predictive operations: The next step after occupancy dashboards is AI that flags leading indicators—teams drifting off hybrid norms, sites with creeping underutilization, rising overtime exposure, or policy exceptions that create compliance risk—early enough to intervene.
- From workflow automation to measurable efficiency: Morgan Stanley Research estimates AI could drive $34B in efficiency gains for the real estate industry over the next five years (through 2030) by automating tasks and improving productivity—exactly the kind of savings corporate occupiers will expect their CRE orgs to capture.
Right now, companies are pouring billions of dollars into the development of AI technology. For now, we’re in a bit of a watch and wait mode to understand how its full potential will affect workforce dynamics. But not to mention, it stands ready to slash hundreds of thousands of jobs.
Looking Ahead: 2026 and Beyond
As we close the books on 2025, a few imperatives emerge for corporate tenants and CRE teams:
- Measure utilization meaningfully: Moving beyond nominal occupancy figures to correlated productivity and performance metrics will define competitive advantage.
- Anticipate hybrid dynamics: The office is no longer “either dead or alive”; it is a flexible, culture-dependent asset whose value must be quantified, not assumed.
- Diversify CRE strategy by sector insight: Industrial dynamics will continue to strengthen, but their performance will be location and use-case specific.
- Embed analytics in every decision: From attendance data to portfolio repositioning, advanced data platforms are no longer optional—they are essential.
2025 wasn’t a year of simple narratives. It was one defined by data-informed nuance, measured progress, and strategic recalibration. For forward-thinking tenants and CRE professionals, the lesson is unmistakable: precision beats prediction.
Turn Insight Into Action With REoptimizer®
If precision beats prediction, then 2026 belongs to the teams that can see their portfolios clearly—and act faster than the market.
REoptimizer® gives corporate tenants a single, decision-ready view of performance across office and industrial portfolios, connecting utilization, attendance, market dynamics, and workforce signals into one strategic platform. Instead of reacting to headlines or relying on averages, CRE teams can identify what’s working, what’s at risk, and where to optimize—before costs, compliance, or underutilization compound.

With REoptimizer®, you can:
-
Measure real utilization—not just leased space
-
Align hybrid strategy with actual attendance and productivity signals
-
Compare asset performance across markets, building types, and use cases
-
Surface risks and opportunities early, using reliable, real-time data
The next CRE cycle won’t be managed quarterly—it will be optimized continuously.
See how leading corporate tenants are using REoptimizer® to turn insight into advantage.
👉 Book a demo and get a portfolio-level view of what your data is already telling you about 2026.
Book a Demo
If 2024–2025 was the “wait-and-see” phase, 2026 is shaping up as the execution window—not because risk disappears, but because financing and expectations are finally aligning enough to transact.
Pricing is more workable, capital is more available (still selective), and a large wave of debt maturities forces real decisions. The result: more motion, more restructuring, and more opportunities for buyers and operators who are prepared.
This isn’t a boom cycle. It’s a reset cycle—where disciplined underwriting and execution matter more than forecasts. Let’s discuss.
Capital Markets Are Re-Opening, But Discipline Is The Price Of Admission
The central trend for 2026 is liquidity with conditions. Deals don’t clear because someone feels optimistic; they clear because the structure makes sense under today’s financing and today’s cash flow.
Three things are pushing activity higher:
-
Debt Maturity Pressure: A meaningful volume of loans are coming due, and not every asset can refinance cleanly at current rates and lender standards. That creates recapitalizations, note sales, extensions, and motivated dispositions.
-
Bid-Ask Spreads Keep Tightening: As more owners accept where pricing is, transaction timelines shorten and deals become executable.
-
Structured Capital Stays Mainstream: Preferred equity, JV recapitalizations, partial sales, and creative lender solutions remain common because they bridge valuation and basis gaps.

Office Continues To Separate Winners From Losers
Office isn’t “back.” But it is becoming more investable—selectively. In 2026, the office market is less about a headline recovery and more about a clean reality: tenants are still leasing, but they’re choosing carefully. That means office performance is increasingly determined by building quality, location, and execution, not “the office sector” as a whole.
The Market Is Defined By Sorting
Buildings that win in 2026 tend to share a few traits:
-
Location and access that make commutes and client visits easy
-
Modern, efficient layouts (flexible floor plates, strong light lines, better circulation)
-
Natural light and comfort that materially improve day-to-day experience
-
Amenities that actually get used (not brochure bait)—conference capacity, food options, fitness, outdoor space
-
A credible tenant experience, meaning the building feels cared for and managed like a product
In practical terms: if a building makes it easier to recruit, retain, and collaborate, it stays in the consideration set.

Commodity And Obsolete Space Faces Hard Choices
On the other side of the market is space that’s functionally behind the times. And here’s the key 2026 dynamic:
Functional obsolescence turns into financial obsolescence fast.
When leasing slows, older buildings typically get hit twice:
-
Revenue pressure from weaker demand (and heavier concessions)
-
Capex pressure from what it takes to compete (lobbies, elevators, HVAC, bathrooms, common areas, spec suites)
That’s when owners end up facing the real decision tree:
-
Reposition (serious capex + a leasing plan)
-
Recapitalize (bring in equity, restructure the stack)
-
Convert (where zoning, economics, and floor plates allow)
-
Exit (sell at a basis the market will accept)
Drifting is expensive. In 2026, the penalty for indecision is usually higher than the penalty for taking a loss and moving on.
Concessions Drive The True Rent
A major reason office narratives get distorted is because people talk about asking rent when the market is being priced through concessions.In 2026, net effective rent is the truth serum.Many deals “work” on paper until you model:
-
Tenant improvements (TI) at current construction costs
-
Free rent
-
Downtime (and the carry cost of vacancy)
-
Leasing commissions
-
Operating expense leakage (especially in partially vacant buildings)
That’s why two buildings with the same asking rent can be worlds apart in actual performance.
What Strong Office Underwriting Looks Like In 2026
Model Net Effective Rent, Not Face Rent
Underwrite the actual deal terms tenants sign—not the number on the brochure. Net effective rent is where value is won or lost.
Treat TI / Free Rent / Downtime As Core Variables
These aren’t footnotes. They are the biggest swing factors in office returns right now. Underwrite them conservatively and stress test them harder than you think you need to.
Prioritize Assets With Simple Plans
The best office deals in 2026 aren’t the ones with the fanciest story. They’re the ones with the clearest path: upgrade → re-tenant → stabilize
If the plan needs perfect timing, perfect rates, and perfect leasing all at once, it’s not a plan—it’s a prayer.

Industrial Moves From Post-Supply Digestion To The Next Growth Phase
Industrial remains one of the cleanest demand stories in CRE, and 2026 looks like the year the sector works through the remaining supply bulge and resumes a steadier growth cadence. Industrial is appearing to finish absorbing the supply bulge and shift back into a healthier, steadier growth rhythm.
Demand Drivers Stay Intact (And They’re Not Going Away)
Logistics And 3PL Keep Expanding
Third-party logistics isn’t a trend—it’s how modern supply chains scale. As shippers push for faster delivery, better inventory positioning, and flexible capacity, 3PL demand keeps showing up in the leasing market. Industrial space is increasingly a service platform, and 3PLs are the operators behind it.
Supply Chain Redesign Creates Durable Space Demand
Companies are still redesigning networks for resilience: more regional distribution, more redundancy, less reliance on single points of failure. That translates into real estate needs that are sticky:
Manufacturing And Tech-Adjacent Uses Add Higher-Value Absorption
The strongest industrial pockets are pulling demand from users that care about power, labor, and throughput—not just rent. Advanced manufacturing, specialized assembly, and tech-adjacent operations can create longer-duration occupancy and better credit profiles when the location works.
The Constraint Investors Underweight: Infrastructure Capacity (Especially Power)
In 2026, industrial markets don’t compete only on location. They compete on deliverability.
Two sites can look identical on a map and perform completely differently in reality—because one can get power, approvals, and utility capacity on time, and the other can’t.
What “infrastructure wins” actually means:
-
Power availability (and realistic timelines to upgrade service)
-
Utility capacity for modern operations (HVAC loads, automation, cold chain, specialized equipment)
-
Speed to permit (municipal process and predictability)
-
Scalability (can the site support expansion or higher-intensity users later?)
The market is pricing speed and certainty. Tenants will pay for facilities that can be delivered on schedule and run reliably. Investors should too.
Data Centers Stay Demand-Led, But Power Becomes The Underwriting Battleground
Data centers continue to attract capital because demand is structural. But 2026 is not just about “more AI.” It’s about the bottlenecks that decide what can actually get built and leased.
The gating issues:
-
Power availability and delivery timelines
-
Interconnection and transmission limits
-
Permitting and community resistance in certain areas
-
Equipment and infrastructure costs
Bottom Line
2026 is a reset year. Liquidity returns, transactions rise, and capital comes back to work—but only for deals that survive real underwriting. Office becomes a selective opportunity set, industrial re-accelerates from a healthier base, and data centers stay hot—while power and infrastructure decide who wins.
If you want to win in 2026, don’t bet on a macro miracle. Build a plan that works anyway.
Ready to act on these trends with real numbers, not headlines? REoptimizer® helps you underwrite smarter, move faster, and avoid the deals that only work in a perfect-rate fantasy.
Whether you’re evaluating an office reposition, screening industrial opportunities, or diligencing a data center site where power is the make-or-break variable, REoptimizer® can help you:
Want a second set of eyes on a 2026 deal? Learn more about REoptimizer® today.
Learn More
Stagnant air, rising energy bills, and surprise equipment failures aren’t “normal warehouse problems”—they’re signs your commercial HVAC strategy isn’t matching the realities of an industrial space. Warehouse HVAC systems have to do more than cool or heat air. They must maintain fresh air, control contaminant buildup, prevent hot-air stratification near the roof, and protect occupant comfort across large, high-volume facilities.
The right solution starts with selecting commercial HVAC equipment and ventilation systems that match your building’s size, ceiling height, dock activity, internal heat loads, and air quality needs—then ensuring the installation, controls, and service plan keep performance stable over time.
Capacity And Energy Efficiency: The Two Metrics That Drive Warehouse HVAC Results
Capacity: Right-Size HVAC Systems For Real-World Loads
An undersized system can’t hold temperature during peak heat gain. An oversized system wastes energy and can short-cycle, reducing efficiency and reliability. Any “rules of thumb” are starting points only—warehouse capacity depends on factors that basic formulas miss:
-
Ceiling height and total air volume
-
Envelope performance (roof and wall construction)
-
Heat-generating equipment (conveyors, battery charging, process loads)
-
Dock doors, infiltration, and air exchange from traffic
-
Occupancy and work intensity
-
Ventilation requirements (outdoor air and exhaust replacement)
Practical takeaway: Capacity is only “right” if the air can be delivered where it’s needed. In warehouses, airflow distribution can make a correctly sized system feel undersized.

Energy Efficiency: Ratings Matter, But Controls And Airflow Often Matter More
Energy efficiency is influenced by equipment selection, but in industrial facilities, the biggest losses often come from poor airflow patterns and control strategy. Look for:
-
High-efficiency equipment where it fits your application
-
Variable-speed or staged operation for part-load efficiency
-
Tight, well-balanced ductwork and well-planned air distribution
-
Control strategies that match ventilation and conditioning to actual demand
If your system runs constantly but still can’t stabilize conditions, you likely have a distribution or ventilation problem—not just an efficiency problem.
Fresh Air And Outdoor Air: The Difference Between A Comfortable Building And A Compliance Risk
In warehouses, temperature control alone doesn’t protect operations. Without enough fresh air, you risk stagnant zones, moisture problems, airborne contaminant accumulation, and unpleasant or unsafe indoor conditions.
A strong warehouse ventilation strategy typically includes:
-
Controlled outdoor air intake to replace exhausted or stale air
-
Exhaust that removes heat or contaminants without destabilizing the building
-
Makeup air that maintains healthy pressure and reduces infiltration from unwanted sources
-
Air movement that prevents dead zones behind racking and in corners
If your facility exhausts air (process exhaust, restrooms, general exhaust) but doesn’t intentionally replace it, the building can pull air from dock doors and leaks—hurting comfort, increasing energy cost, and reducing system performance.

Air Handling Units And Outdoor Air Handling Units: When You Need Each
Air Handling Units (AHUs)
Air handling units are common in large commercial buildings and industrial facilities because they can move high volumes of conditioned air and support filtration and distribution through ductwork.
Best fit for warehouses when you need:
-
Higher airflow capacity across large spaces
-
Better filtration and consistent air distribution
-
Flexible integration with heating and cooling equipment
Outdoor Air Handling Units (OAHUs)
Outdoor air handling units are designed to manage outdoor air and deliver consistent fresh air without destabilizing indoor temperature control. In warehouses, they’re valuable when ventilation requirements are significant or when air quality control is a priority.
Best fit when you need:
-
Reliable fresh air delivery across changing occupancy or operations
-
Better control over temperature and humidity of incoming air
-
A clearer ventilation “backbone” that supports comfort and compliance
Bottom line: If “air quality,” odors, headaches, or stale air are the complaint, adding cooling capacity alone won’t fix it. Outdoor air strategy and air handling are often the real solution.

Types Of Commercial HVAC Equipment For Warehouses (Pros, Cons, And Applications)
Rooftop Units (RTUs)
RTUs are widely used in industrial and commercial facilities because they consolidate heating and cooling into packaged units and keep equipment off the floor.
Ideal for:
Key watch-outs:
-
Dust-heavy environments can reduce performance fast without proper filtration and service
-
High ceilings can create uneven comfort unless airflow distribution is addressed
-
Roof exposure can stress equipment without a reliability-focused maintenance plan

Variable Refrigerant Flow (VRF) Systems
VRF provides zoning flexibility and efficient part-load operation, especially helpful when warehouses include offices or temperature-sensitive zones.
Ideal for:
Key watch-outs:
-
VRF still needs a ventilation plan for fresh air
-
Best results require thoughtful design, controls, and commissioning
Evaporative Cooling (Where Climate Supports It)
Evaporative systems can be cost-effective in hot-dry regions and naturally move more air through the building.
Ideal for:
Key watch-outs:
HVLS Fans (High Volume, Low Speed)
HVLS fans don’t cool air directly, but they dramatically improve air movement and destratify hot air that gets trapped near the roof—boosting comfort and improving how well conditioned air reaches the floor.
Ideal for:
Key watch-outs:
-
They are a support solution—pair them with HVAC and ventilation strategy for best results
-
Placement must consider racking, lighting, and fire protection constraints

Airflow Patterns: The Most Common Reason Warehouse HVAC “Doesn’t Work”
Warehouses often fail on airflow, not equipment. Red flags include:
-
Hot upper layers and cool lower layers (stratification)
-
Stagnant corners or mezzanine zones
-
Strong airflow in some aisles and no movement in others
-
Comfort complaints near dock doors (infiltration)
-
Equipment that runs constantly but never stabilizes conditions
Fix focus: Supply and exhaust placement, outdoor air strategy, mixing/destratification, and ductwork balance usually unlock performance faster than replacing units.
Control Technology: How To Improve Efficiency Without Replacing All Equipment
Modern control strategies can meaningfully improve performance and energy efficiency:
-
Demand-based ventilation (adjust fresh air to occupancy/CO₂ and humidity)
-
Scheduling and staging (avoid full-load operation when unnecessary)
-
Thermal mapping and zone sensing (find heat pockets early)
-
Automated dampers and louvers (optimize outdoor air and pressure balance)
-
Load shifting (pre-cool/pre-heat during off-peak utility periods)
In industrial facilities, better control is often the highest-value “innovation” because it improves outcomes using existing equipment—when the airflow strategy is solid.
Ductwork And Installation: Where Performance And Efficiency Are Won Or Lost
Even industry-leading equipment underperforms with weak installation. Common performance killers:
-
Leaky or poorly sealed ductwork
-
Imbalanced supply/exhaust causing pressure problems
-
Poor diffuser and return placement creating dead zones
-
Inadequate commissioning (systems never tuned to the building)
If two facilities install similar commercial HVAC equipment but get different results, the difference is often ductwork quality, airflow planning, and control configuration.
Reliability And Service: Protecting Compressors And Preventing Costly Breakdowns
Warehouse environments are tough on HVAC equipment. Reliability depends on a preventive plan that matches your facility:
-
Regular filter changes (especially in dusty operations)
-
Coil cleaning to maintain airflow and heat transfer performance
-
Refrigerant checks and inspections to protect compressors
-
Fan/motor/belt inspections to keep air moving reliably
-
Drain and moisture management to prevent corrosion and microbial growth
Operational value: reliability is not only about comfort—it protects uptime, reduces emergency service calls, and preserves energy efficiency over time.
How To Execute Warehouse HVAC Decisions During Site Selection And Keep Them On Track
The hardest part of warehouse HVAC isn’t understanding the options—it’s ensuring the building and the project can deliver the required performance.
REoptimizer® For Site Selection In Industrial Facilities
REoptimizer® supports site selection by helping teams evaluate a warehouse’s HVAC feasibility in context—seeing how building factors and geographic considerations can affect:
-
airflow distribution potential in large-volume space
-
viability of outdoor air strategies (including outdoor air handling units)
-
constraints that affect installation and long-term efficiency
-
comfort and sustainability requirements across facilities being compared
REoptimizer® For Project Monitoring And Performance Alignment
REoptimizer® supports project monitoring by keeping performance requirements visible as designs change:
-
maintaining clarity on ventilation intent and outdoor air assumptions
-
tracking decisions that affect airflow patterns and occupant comfort
-
supporting coordination around installation, controls, and deliverables
-
reducing the chance that scope changes undermine reliability and efficiency
In short: the right system is a combination of equipment, airflow design, and controls—and REoptimizer® helps teams choose facilities that can support that solution and keep the project aligned until handoff.

Frequently Asked Questions
What Does “Commercial HVAC” Mean For Warehouses?
In this context, commercial HVAC refers to industrial-grade heating, ventilation, and cooling systems used in warehouses and distribution facilities—focused on airflow, fresh air, energy efficiency, reliability, and occupant comfort at large scale.
What Commercial HVAC Equipment Is Most Common In Warehouses?
Many warehouses use RTUs or AHUs paired with mechanical ventilation or outdoor air strategies. HVLS fans are commonly added to improve airflow and destratification.
Do Warehouses Need Outdoor Air Handling Units?
Not always, but they’re often beneficial when consistent fresh air delivery, better air quality control, or stable ventilation performance is required.
Why Is My Warehouse Still Hot Even With Cooling?
Usually because of airflow distribution problems—stratification in tall spaces, dead zones, infiltration at dock doors, ductwork leakage, or poor supply/return placement.
What Improves Warehouse HVAC Energy Efficiency The Most?
Right-sizing, fixing airflow distribution, sealing ductwork, and implementing control strategies (demand ventilation, staging, scheduling) typically drive the biggest real-world gains.
Industrial ingress and egress design is the planning of how trucks, forklifts, cars, and pedestrians enter, circulate, queue, load, and exit a facility safely and efficiently. The most effective way to reduce congestion and incident risk is to separate traffic types, minimize reversing, size apron space correctly, and place docks to reduce forklift travel and cross-traffic.
Poor layouts don’t just waste time and fuel—they create higher-consequence conflict points where heavy equipment and people intersect.

What Is Causing Warehouse Yard Congestion (And How Do You Spot It Fast)?
Most ingress/egress problems come from one of these root causes:
-
No Truck Queue/Waiting Area → trucks stack at doors and block circulation
-
Undersized Apron Depth → repeated repositioning + slow dock cycles
-
Mixed Traffic Zones (trucks + cars + pedestrians) → stop-and-go patterns and near misses
-
Too Much Backing (forced reversing) → higher-risk maneuvers and longer cycle time
-
Dock Layout Forces Crossing Movements (receiving/shipping overlap) → forklift gridlock and staging conflicts
If your yard “feels busy” but not controlled, you’re usually missing one of the above.
What Is The Material Transfer Zone (MTZ) And Why Is It “Ground Zero” For Risk?
The Material Transfer Zone (MTZ) is where trailers, forklifts/pallet jacks, dock doors, levelers, and people converge. It’s high-risk because it compresses heavy equipment, blind spots, and time pressure into limited space.
MTZ Safety Must-Haves
-
Trailer Movement Control (restraints) to prevent creep
-
Barrier Gates to prevent edge falls and equipment damage
-
Preventive Maintenance (levelers, bumpers, lighting, seals)
-
Leveler Capacity Matched To Load + Frequency
Best Practice: powered hydraulic levelers (push-button) typically improve ergonomics and consistency versus manual mechanical units.

Are Your Loading Docks In The Best Spot? (How Dock Placement Affects Forklifts, Staging, And Delays)
Your docks are in the best spot when they:
-
Minimize Forklift Travel between receiving → storage and picking → shipping, and
-
Avoid Forced Crossing between trucks, forklifts, and pedestrians.
But dock placement isn’t just a building decision—it’s a flow decision. The “right” configuration depends on how many truck moves you handle, how much staging space you have, and whether you can keep inbound/outbound activity from competing in the same footprint.
In practice, most dock strategies fall into two common types: a Combined Dock Layout (shared receiving and shipping at one dock face) and a Separated Dock Layout (distinct receiving and shipping zones).
We’ll explain when each layout works, where it breaks down, and what to look for so the design supports fast turnarounds without increasing conflict and congestion.
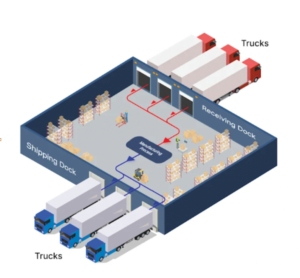
Combined Receiving + Shipping Dock Layout
Best For
Trade-Offs
-
Inbound/outbound compete for the same face
-
Staging becomes cluttered faster
-
Forklift travel lengthens (small minutes compound across a shift)
Separated Receiving And Shipping Dock Layout
Best For
Advantages
-
Cleaner staging discipline
-
Fewer forced interactions
-
Easier to maintain predictable yard flow
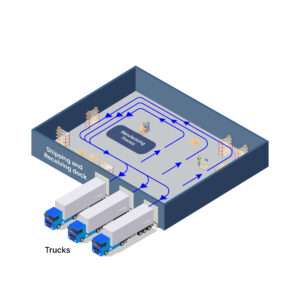
What Is The Best Traffic Flow Pattern For A Warehouse Site?
The best yard flow is predictable and reduces reversing. A common “win” pattern is a one-way circulation loop plus dedicated truck waiting space so the dock face stays clear.
Recommended Site Traffic Flow Design
-
One-Way Circulation where feasible
-
Dedicated Truck Waiting/Queue Area off the dock face
-
Separate Truck Routes From Employee Parking/Pedestrian Entrances
Common Baseline Geometry (53-Ft Trailer Planning)
-
Inside Turning Radius: ~26 ft
-
Outside Turning Radius: ~50 ft
-
One-Way Access Road Width: ~13 ft minimum
-
Two-Way Access Road Width: ~26 ft minimum
(These are baseline planning numbers—final design should be validated to your design vehicle and constraints.)
What Is Dock Apron Space—And How Much Do You Need For 40’, 48’, And 53’ Trailers?
Apron space is the maneuvering area in front of the dock that lets trucks align and back safely. Undersized aprons cause:
Practical Apron Depth Guidance
A commonly used planning table for 40-ft trailers often lands around ~108–120 ft depending on center-to-center spacing.
Scaling guidance used in planning:
Takeaway: If you handle 53-footers and see repeated alignment delays, apron depth is often the hidden bottleneck.

What Dock Height Is Standard (And Why Does It Matter)?
A common warehouse dock height range is 48″–52″, depending on the trailers served. Correct height reduces:
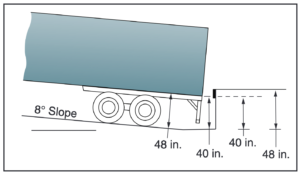
How Steep Can A Dock Approach Slope Be For Forklifts?
Steep slopes increase tipping risk and reduce load stability.
Common guidelines:
-
Electric Forklifts: max ~10% slope
-
Gas/Diesel Forklifts: max ~15% slope
-
Ideal Recessed Dock Slope: ≤ ~6%
If you’re above ~10% where forklifts carry load and speed, you’re compounding risk and inefficiency.
How Do You Reduce Parking Lot Accidents At Industrial Sites?
The highest-ROI move is traffic separation:
-
Separate employee parking from truck yards
-
Build protected pedestrian paths (not shared asphalt)
-
Use controlled crossings, clear sightlines, signage, speed control
-
Keep visitor circulation away from dock maneuvering zones
This reduces conflict structurally instead of relying on perfect behavior.
How Do You Execute This During Site Selection And Keep It From Drifting During The Project?
Once you know the “right answers” (apron depth, turning room, separation, dock placement), the challenge becomes: can the site support it—and will the project deliver it? This is where REoptimizer® becomes the execution layer.
REoptimizer® For Industrial Site Selection
Use REoptimizer® to compare candidate sites by making key factors visible in one place—especially the constraints that drive ingress/egress success:
-
Site Access And Circulation Feasibility (how trucks can realistically enter/exit and loop)
-
Geographic Considerations (grade, adjacency, road context, space depth)
-
Separation Potential (truck yard vs employee parking vs pedestrian routes)
-
Dock Strategy Fit (can you support separated zones or will you be forced into a combined face?)
REoptimizer® For Project Monitoring (Design → Build → Operate)
Use REoptimizer® to keep the original flow-and-safety intent from getting diluted across revisions:
-
Track whether apron depth, turning assumptions, and queue areas survive redesigns
-
Maintain visibility into dock placement logic and forklift travel implications
-
Flag when changes reintroduce mixed traffic zones or forced backing
In other words: the guide tells you what “good” is; REoptimizer® helps you select sites that can actually deliver it and monitor the project so it stays aligned.
Frequently Asked Questions
What Does “Ingress And Egress” Mean In Warehouse Design?
It refers to how vehicles and people enter, circulate, queue, interact with docks, and exit—safely and efficiently.
What Is The Most Common Warehouse Yard Bottleneck?
Typically: undersized apron space, no truck waiting area, or dock placement that forces crossing/competition.
Should Receiving And Shipping Docks Be Separated?
For high-volume facilities, separation often improves flow by reducing competition and simplifying staging and forklift routing.
How Much Apron Depth Do I Need For 53-Ft Trailers?
Many layouts require substantially more than 40-ft baselines; designs can reach ~140 ft depending on spacing and maneuver strategy.
What Is Standard Dock Height?
Often 48″–52″, depending on the trailer fleet served.
What Slope Is Safe For Forklifts At Dock Approaches?
A common guideline is ≤10% electric and ≤15% gas/diesel, with ≤6% preferred where possible.
How Does REoptimizer® Help With Ingress/Egress Decisions?
It supports site selection (seeing feasibility against geographic and layout constraints) and project monitoring (keeping circulation, separation, and dock requirements visible through revisions). Learn more about how it can level up your industrial portfolio today.
Learn More
When Prologis talks, the logistics world listens. With visibility into thousands of facilities across global markets their analysis is a working blueprint for how occupiers will need to adapt.
The short version: Vacancy is tightening where you want to be, utilization is rising, trucking is getting more expensive, power is the new gating factor, and specialized demand (e-commerce, manufacturing, defense) is quietly rewriting what “prime” industrial really means.
If you’re a large corporate tenant with a national or global footprint, this isn’t background noise. It’s a direct signal to reassess where you’re located, how much space you’re holding, and what kind of buildings you’ll need next.
1. Utilization Is Rising: Slack in the System Is Disappearing
Prologis’ analysis shows U.S. warehouse utilization is climbing but still below the expansionary threshold of 85.5%. The move upward in 2025 has been led by essential goods, e-commerce, and manufacturing users, with wholesalers and manufacturers frontloading inventory earlier in the year and retailers following heading into the holidays.

If the current pace continues, Prologis projects customers will hit functional capacity in 2026. Historically, this pattern has preceded sharp tightening: utilization rebounded quickly in 2014–2015 and 2021–2022 after periods of elevated vacancy and “logistics slack.”
Translation for occupiers: the window where you can “take your time” on new site decisions is closing.
What tenants should take from this:
- If you’re running hot on utilization today, assume you’ll be competing for space in 12–18 months — not browsing.
- If you’ve been using “excess” locations as a buffer, that slack may become more expensive to replace later.
- This is a good time to audit your portfolio: which sites are truly strategic, which are legacy, and where will you need expansion rights or options?
2. E-Commerce Is Still the Quiet Dominant Force in Leasing
Prologis expects e-commerce companies to account for nearly 25% of new leasing in 2026, as the proportion of goods sold online approaches about 20% globally. And this isn’t just Amazon in big U.S. metros anymore.
Key dynamics Prologis highlights:
- Global online penetration is expected to reach ~19.7% by 2026.
- Asian e-commerce players that entered the U.S. via direct leases and 3PLs are now expanding into Europe and Latin America for cross-border fulfillment.
- In India, platforms like Flipkart and Walmart are adding capacity to serve domestic and export demand.
- De minimis rule changes in the U.S. are pushing e-commerce companies toward blended strategies: onshore inventory, sea-cargo cross-docking, and faster regional fulfillment to manage duties and cross-border complexity.
Why this matters for large occupiers:
You don’t have to be an e-commerce brand to feel the impact. When 25% of new leasing is driven by one use case, that cohort sets the bar for location, speed, and building specs:
- Expect continued competition for close-in, high-throughput facilities in major consumption zones.
- E-commerce demand raises expectations for clear heights, loading ratios, parking, automation readiness, and power — and landlords will price accordingly.
- If your business model depends on slower decision cycles than e-commerce players, you’ll need better data and earlier internal approvals to avoid being outmaneuvered.

3. U.S. Gateways Are Back in Favor (on New Terms)
During the pandemic, coastal gateway markets like the Inland Empire and New Jersey saw rents spike far ahead of the rest of the U.S. That gap has since narrowed. Prologis notes:
- Rent premiums that “blew out” during the pandemic have compressed back toward pre-pandemic spreads.
- As networks evolve to manage both cost and service, coastal and near-port markets are poised for a demand recovery, with:
- Access to dense population centers
- Better availability of modern Class A stock
- Rents that have “reset” to more sustainable, though still premium, levels
Why this matters for your network design:
- If you pulled back from coastal markets purely on cost, it may be time to re-run the math. Transportation is getting more expensive (more on that below), which shifts the value back toward well-located, rent-pricier facilities.
- The price-to-value ratio for gateway locations looks more attractive than it did at the 2021–2022 peak.
- Corporate tenants that move early can secure modern buildings in strategic positions while there’s still some optionality.

4. Power Is the New Location Filter
Location used to mean proximity to ports, highways, labor, and rooftops. In 2026, power availability joins that list as a top-three factor in site selection, according to Prologis.
Several pressure points they highlight:
- In Europe, new development is constrained by grid connection delays and capacity caps, driving interest in micro-grid and on-site solutions.
- In Mexico’s manufacturing-heavy markets, lack of power is already the top constraint for new tenants; transformer utilization in major hubs exceeds recommended levels.
- In the San Francisco Bay Area, Prologis estimates only around 2% of 110/230 kV substations that can serve industrial/logistics users have available firm capacity.
- Fully automated facilities can use 3–5x more power than a 2024 baseline.
What tenants need to change in their approach:
- Stop treating power as a checkbox and start treating it as a core underwriting variable. It should sit alongside rent, TI, and transportation in your internal models.
- Ask for detailed utility profiles during site selection: existing capacity, potential upgrades, timing, and cost — not just “power: yes.”
- If automation, advanced manufacturing, or dense robotics are on your roadmap, you’ll need ahead-of-curve power planning, not “we’ll deal with that in phase two.”

5. Defense and Advanced Manufacturing Are Soaking Up Specialized Space
Prologis expects defense-related demand in the U.S. and Europe to create a new class of specialized logistics and industrial assets:
- European countries are signaling plans to increase defense spending to about 5% of GDP, up from an average of 2.5% in 2024.
- Spending and activity are clustering in strategic industrial corridors across Germany, France, Italy, the UK, the Netherlands, and Poland.
- In the U.S., elevated DoD spending supports steady demand, but what’s changing is the diffusion of work: more small and midsize suppliers entering the market and leasing industrial space for localized, secure, and often power-intensive operations.
- Many of these users are targeting older, well-located product that happens to feature strong power and heavy manufacturing specs built during prior industrial booms.
Why non-defense tenants should care:
- You may find yourself competing for the same high-spec, high-power, well-located assets, even if you’re not in aerospace or defense.
- Older buildings with strong bones and robust utilities are being re-rated upward, especially in legacy industrial corridors.
- If you rely on similar specs — heavy utilities, secure operations, specialized floor loads — you can’t assume legacy space will remain “discount” forever.

6. Trucking Capacity Is Shrinking — and Freight Costs Are Rising
If you build your network assuming transportation capacity will be there at the right price, 2026 may test that assumption. Prologis points to:
- A shrinking pool of U.S. truckers as the freight recession drags on and new regulations (including English language requirements) push some drivers out.
- Smaller carriers under stress, with active carrier authorities 12% below their 2022 peak.
- National tender rejections up over 100 basis points vs. 2024, foreshadowing tighter conditions and higher rates.
- Spot rates up 4% compared with the 2024 average, with further increases expected into 2026.
- Freight costs up 3.5% in 2025, with Prologis expecting double-digit rate hikes in 2026.
Their conclusion: transportation will take an even larger share of total supply chain spend, and well-located logistics real estate becomes a hedge against those rising costs.
The strategic takeaway for occupiers
- Your total cost of occupancy must now explicitly integrate transport cost trajectories, not just today’s rates.
- Facilities that shorten last-mile or middle-mile routes, reduce empty miles, or enable mode-shifting (e.g., to rail or port drayage) will justify higher rent — and still be cheaper on a total landed cost basis.
- Network optimization isn’t a one-off project. It’s now part of ongoing portfolio management.
So What Should Large Tenants Do Now?
Given Prologis’ vantage point and past predictive accuracy, it’s reasonable to treat these signals as a working scenario, not a speculative story. For large-scale corporate tenants and C-suite executives, the playbook for 2026 looks something like this:
- Audit your utilization and pipeline.
Know where you’re trending toward capacity, where you’re underutilized, and where you’ll need flexibility. Build options — not just fixed commitments — into critical markets.
- Revisit your network design with updated cost assumptions.
Factor in rising freight costs, tighter trucking capacity, and more expensive power. Locations that once felt “too expensive” on rent may now be cheaper when you include transport.
- Prioritize power in every RFP.
Require clear documentation of available capacity, upgrade paths, and timing. If automation or manufacturing are part of your plan, treat power as a board-level risk, not an engineering footnote.
- Watch the competitive set beyond your own industry.
You’re not just competing with other retailers, manufacturers, or tech firms. You’re competing with e-commerce giants, defense suppliers, and advanced manufacturers for a finite pool of high-quality industrial product.
- Use data to negotiate and prioritize.
Prologis’ research shows directional trends; your internal data shows your actual cost-to-serve by node. Combine the two to decide where rent truly matters and where transportation and power are the real swing factors.
The industrial market heading into 2026 isn’t collapsing, and it isn’t exploding. It’s tightening, re-pricing, and re-sorting around power, proximity, and performance. Prologis’ latest outlook offers a clear message: the companies that treat logistics real estate as a strategic lever — not a back-office line item — will be the ones that come out ahead.
The market is rewarding companies that treat logistics real estate as a strategic weapon. REoptimizer® shows you exactly where to cut cost, capture opportunity, and outmaneuver competitors. Spot inefficiencies, reveal savings, and model smarter logistics decisions in minutes. Discover the platform built for the new 2026 landscape. Unlock the insights — see how it works.
Learn More
Miami’s industrial market has spent the last several years reshaping itself into one of the most competitive logistics environments in the United States — not through hype, but through consistent performance. Since 2020, the region has demonstrated a steady combination of rent growth, tightening vacancy, and durable demand across nearly every major submarket. Q3 2025 continues that pattern, and for large corporate occupiers, the signal is clear: Miami requires a more strategic, data-driven approach to footprint planning.
Below, we break down the trends that matter most for decision-makers — and what they mean for tenant strategies going forward.

Rents Continue Rising — And Not by Accident
Q3 2025 marked the fifth consecutive quarter of rental growth, with average direct asking rents reaching $17.59 psf NNN, up 21 basis points from Q2. That might not sound dramatic, but in the industrial world, five straight quarters of increases is meaningful. It illustrates a market that is neither cooling nor plateauing; instead, it’s demonstrating resilience even as deliveries continue.
What’s more striking is the rent bifurcation that has been building since 2020. Core submarkets such as Airport West, Medley, and Kendall command $9–$11 psf premiums over their 2020 rents. The report’s submarket comparison shows:
-
Kendall at $22.04 psf
-
Central Dade at $22.71 psf
-
Airport West at $19.58 psf
-
Meanwhile, relatively more affordable pockets like Hialeah remain at $14.63 psf
For occupiers, the takeaway is not simply that rents are high. It’s that Miami’s pricing structure has become more stratified, making location decisions more financially consequential. Choosing the right submarket can translate to millions in occupancy cost differences over a multi-year term.
Vacancy Remains Low Enough to Give Landlords Confidence
Market-wide vacancy landed at 5.8%, with direct vacancy at 5.5% and sublet space at just 0.3%. Sublet availability often serves as a pressure-release valve in tight markets; here, that valve is barely cracked open.

Vacancy by submarket tells an even clearer story:
Even the submarkets with higher vacancy are not “soft” by national standards. Everything sits firmly within what analysts would categorize as landlord-favorable conditions.
For corporate occupiers, this means fewer options, shorter decision timelines, and a leasing environment where competing tenants often circle the same viable spaces. If your organization values optionality, Miami will challenge that preference.
Absorption Rebounds, Signaling Renewed Demand
One of the most important Q3 metrics is the rebound in demand. Net absorption reached 670,459 square feet, more than doubling Q2’s total. This is not a spike driven by one outsized deal; it reflects a broad re-engagement from tenants across diverse sectors.
Notable transactions from the quarter include:
-
The American Bottling Co. – 150,600 sf
-
Amcar Freight – 126,101 sf
-
United States Postal Service – 86,867 sf
-
Vista Color Corp – 75,000 sf (renewal)
These deals span manufacturing, logistics, freight, and service providers — a healthy sign that the demand base is diversified rather than dependent on one driver.
This level of absorption, combined with low vacancy, suggests that Miami’s market position is not cyclical noise; it’s structural.

New Construction Is Active — But Still Not Loosening the Market
Year-to-date deliveries total 2.2 million square feet, and another 3.8 million square feet are under construction. That’s a substantial pipeline for a geographically constrained region.
However, current data shows that ongoing deliveries aren’t easing fundamentals:
-
Vacancy decreased 20 bps quarter-over-quarter
-
Rents increased for the fifth straight quarter
-
Absorption absorbed supply without a rise in available space
In short: supply is coming, but demand is keeping pace. And because Miami’s development capacity is limited by land availability, this pattern is unlikely to change materially in the near term.
Some Submarkets Are Tightening Faster Than Others
Drilling into the submarket data reveals important patterns for occupiers evaluating site selection:
1. Kendall & Central Dade: Highest Rents + Lowest Availability
With rents above $22 psf and vacancy between 1.4% and 5.6%, these infill submarkets offer operational advantages (population density, proximity to consumption), but at a cost. Expect minimal concessions and a very limited inventory of modern product.
2. Hialeah & Northeast Dade: Value Submarkets Gaining Momentum
Hialeah’s 3.1% vacancy and $14.63 psf rent make it a relative bargain. Northeast Dade, at $15.70 psf, showed notable absorption as well. These submarkets may become increasingly competitive if pricing in northwest and central areas continues climbing.
3. Northwest Dade: More Availability, Still Rising Rents
With the highest vacancy (8.3%), Northwest Dade offers more immediate options, but rents remain elevated at $16.31 psf. As newly delivered product comes online, this may become the “value with breathing room” submarket for large-scale occupiers.
4. Airport West & Medley: Core Logistics Hubs Stay in Demand
Airport West alone has 61.9 million square feet of existing inventory and 2.4 million square feet under development. These locations remain the heartbeat of Miami’s distribution network. Rents remain elevated but justified by access advantages.
For executives managing multi-site footprints, submarket positioning is a core strategic variable.

Investment Activity Reinforces Long-Term Stability
One of the clearest indicators of Miami’s sustained strength is investor behavior. In Q3:
-
Miami led Florida with $687M in industrial sales
-
Average pricing achieved $276 psf — the highest in the state
-
Major institutional investors like Terreno Realty and Link Logistics remained active buyers
This sets an important tone: institutions are pricing Miami as a premium industrial market — and their underwriting assumptions typically reflect long-term rent growth and low structural vacancy.
For occupiers, institutional ownership has two implications:
-
Lease negotiations become more standardized and more formal
Large owners tend to keep tight ranges on concessions, term flexibility, and TI allowances.
-
Operating expenses may increase
Enhanced asset management, capital improvements, and stricter maintenance schedules typically follow institutional acquisition.
Neither of these is inherently negative. But they require occupiers to forecast total occupancy costs — not just base rent — more rigorously.
What This Means for Corporate Occupiers
Based on Q3 performance and broader market patterns, Miami demands a more proactive, more analytical approach. The strategies that worked five years ago are unlikely to perform well today.
Here’s what large tenants need to prioritize:
1. Start Renewals Earlier and Model Multiple Scenarios
Given 5.8% vacancy and minimal sublet availability, waiting to approach a renewal until the final 12 months of a lease is risky. Early engagement allows:
-
Cost modeling across multiple submarkets
-
Exploration of off-market options
-
Better positioning against competing tenants
Miami is a market where optionality shrinks quickly.
2. Run a Submarket-Level Cost-of-Operations Analysis
The report’s rent disparities can materially impact:
A location at $14.63 psf vs. $22.71 psf isn’t just a rent difference — it’s a supply chain design choice.
3. Evaluate New Construction Early — Not Late
With 3.8 million square feet in the pipeline, Class A options exist or will exist soon. But many of these:
-
Deliver with pre-leasing already in place
-
Lease ahead of shell completion
-
Come at a premium but provide operational advantages (clear heights, loading ratios, energy efficiency)
The companies evaluating new builds now will have the first pick of suitable layouts.

4. Leverage Multi-Market Strategy to Optimize Miami Exposure
If high rents in core Miami aren’t essential to operations, consider:
-
Hybrid strategies (bulk storage outside Miami + last-mile inside Miami)
-
Shift of non-time-sensitive operations into value submarkets
-
Shorter terms in constrained areas to maintain agility
Miami’s density and growth make it a high-value node, but not every function needs to sit within the highest-cost zones.
5. Strengthen Data-Driven Portfolio Planning
With rents having risen for five consecutive quarters and core submarkets holding price premiums since 2020, occupiers should:
-
Model future rent escalations
-
Analyze occupancy cost inflation
-
Use scenario planning for long-term commitments
Cost predictability is becoming harder — and therefore more essential.
Positioning for the Next Phase of Miami’s Industrial Evolution
Miami’s industrial market is not defined by volatility or dramatic swings. Instead, Q3 2025 affirms a pattern of steady, durable, and broad-based strength. The region continues to cement its place as Florida’s premier logistics hub, supported by land constraints, diversified demand, and sustained investor confidence.
For corporate tenants, the opportunity lies in adapting early. Those who treat Miami simply as “another logistics node” will pay a premium for it. Those who treat Miami as a strategic, data-intensive occupancy challenge will unlock better—often significantly better—long-term outcomes.
The industrial market is evolving. Tenant strategy needs to evolve with it.This is where intelligence becomes a differentiator.
REoptimizer® gives occupiers the visibility, modeling power, and comparative insight needed to navigate Miami’s evolving landscape (while mapping comparisons to other markets) with intention rather than reaction. If the next phase of your strategy requires clearer decisions, stronger leverage, and fewer surprises, this is the platform built to deliver it. Learn more how this tool can give your portfolio the razor sharp edge it needs.
Learn More
If you follow the U.S. industrial market, you’ve probably gotten used to a particular storyline over the past few years: record-breaking e-commerce growth, tight vacancy rates, relentless rent growth, and construction cranes populating the skyline from the Inland Empire to Dallas–Ft. Worth to Kansas City. But in Q3 2025, the NYC Outer Borough industrial sector delivered a different kind of plot.
Leasing slowed, net absorption slid into the red, and tenants became noticeably more selective as economic conditions, policy uncertainty, and higher input costs shaped decision-making. Yet for all that, pricing barely budged, new supply barely materialized, and the region’s critical role in national supply chains—including distribution operations, manufacturing, and even emerging green energy and data center infrastructure—kept fundamentals stable.
Corporate real-estate teams tracking industrial properties, construction pipelines, and key markets across the country will find familiar patterns here: slowing but not collapsing demand, sticky rents, cautious investment activity, and a back-to-basics recalibration of how companies use space.
Let’s break down the key trends shaping the NYC market—and what large tenants should be doing now to stay ahead.
Leasing Activity Slows as the Market Takes a Breath
The headline from Q3 is simple: leasing cooled. According to the report, leasing activity dropped 52.8% from the previous quarter, totaling 735,469 square feet, and marking a 13.2% decline year-over-year. For context, this slowdown follows several multiple years of deals that often exceeded pre-pandemic levels, fueled by manufacturing investment, reshoring, and the national obsession with efficiency in logistics.
And while New York didn’t see the blockbuster “50 tenants fighting for one building” energy of 2021–2022, the industrial real estate market isn’t exactly collapsing. What’s really happening is a shift in who is transacting—and for how much space.
The Rise of the Small and Mid-Sized Tenant
Instead of big national 200,000-SF requirements, Q3 deals centered on smaller footprints, with Brooklyn and Queens representing 80% of all leases signed. The largest new lease? A modest 61,425-SF commitment in South Queens. Other notable deals clocked in at 50,000 SF, 35,000 SF, and 31,450 SF. In other words, demand hasn’t disappeared—it’s just wearing a smaller pair of shoes.
For corporate CRE teams with national portfolios, this mirrors what we’re seeing in several markets across the country: tenants using this phase of economic uncertainty to recalibrate operations, downsize inefficient footprints, or strategically expand only into buildings that offer compelling value.

Negative Absorption Pushes Availability to 9.7%—Still Low by National Standards
The market posted –161,306 SF of net absorption, pushing availability from 9.5% to 9.7%. Before you panic, let’s put that into perspective:
-
The Bronx and Staten Island—with large single vacancies—skew the average.
-
North Brooklyn sits at a virtually nonexistent 5.0% availability rate.
-
Northeast Queens is even tighter at 5.3%.
-
The national u.s. industrial vacancy rate is hovering around the mid-4% range.
So yes: New York saw negative absorption, but it remains one of the country’s most constrained industrial markets, with high barriers to entry, zoning constraints, and basically no land left unless someone wants to build a warehouse on the deck of the Kosciuszko Bridge.
The biggest drag on absorption was the return of a 127,587-SF warehouse in Central Queens to the market—one large block can swing a quarter’s statistics. Corporate occupiers reading too much into one quarter’s downward pressure might miss the bigger picture: this is a market that historically snaps back hard the moment demand firms.
Pricing Holds Firm Despite Softer Demand
Perhaps the most surprising storyline of Q3: rent growth did not fall off a cliff. The average asking rent ticked up slightly to $27.64 per square foot, though still 2.4% below the same period last year. Why is pricing so sticky? Because even when leasing slows, the supply of functional industrial buildings in New York is—technically speaking—laughably small.
A few factors keep rents elevated:
1. The Scarcity Index Doesn’t Lie.
Even with some new space hitting the market in recent years, the total industrial inventory is a rounding error compared to markets like Chicago or Dallas. When your entire borough’s available inventory fits into a single million-square-foot Midwestern mega-shed, rents aren’t likely to crater.
2. Class A Buildings Still Command Premiums.
Newer facilities—especially multi-story ones—are quoting rents in the mid-to-high $30s per square foot. And tenants pay it because access to dense populations shortens delivery windows, cuts last-mile costs, and supports distribution operations that depend on speed.
3. Landlords are Using Concessions Instead of Cuts.
Free rent and TI packages are up. Rent reductions? Still not fashionable.
Construction Starts Slow Dramatically—Which Supports Future Rent Growth
If you’re waiting for a wave of new construction deliveries to rebalance supply and put downward pressure on rents… don’t. New York saw no new inventory delivered this quarter, and just 1.2 million square feet remains under construction—barely 0.8% of total inventory. For context, the nation’s top key markets regularly have 20–40 million square feet under development at any given time.
Why the slowdown?
-
Higher input costs continue to make proformas painful.
-
Institutional investors have hit pause on speculative ground-up projects.
-
Trade policies, zoning hurdles, and permitting timelines slow everything.
-
Debt is pricey, even after anticipated future interest rate cuts.
Of the few projects moving forward, the biggest is a 682,000-SF multi-story development in Northwest Queens. Multi-story continues to dominate NYC industrial development, representing 70%+ of the pipeline. In short: supply is not coming to save tenants. Not soon, anyway.
What Tenants Need to Know Now: Strategy Matters More Than Ever
With markets across the country showing signs of transition, corporate occupiers are recalibrating their strategies nationwide. But New York requires especially sharp decision-making. Here’s what you need to focus on in the fourth quarter and into 2026:
1. Don’t Assume Slowing Demand Means Cheap Space.
The NYC industrial market is not like others. It does not respond quickly to economic uncertainty, nor do landlords panic when one quarter posts negative absorption. Expect modest rent growth to resume once demand stabilizes.
2. Start your Search Earlier than Ever.
With availability under 10% and much of that in buildings that would make your operations VP cry, tenants needing large blocks have limited options.And with so little new construction, options aren’t improving soon. Time is leverage—use it.
3. Evaluate Operational Fit, Not Just Rent.
Given the scarcity of space, many tenants are looking at Class B buildings, older warehouses, or locations they would have dismissed multiple years ago. Before signing:
-
Audit production and distribution workflows.
-
Reassess logistics models (especially if operating pre-pandemic layouts).
-
Evaluate whether expanding to adjacent markets improves cost-per-delivery.
The “best” building may not be in NYC at all—hence the rise of regional strategies involving New Jersey, Pennsylvania, and even Upstate.
4. Incorporate Resilience Planning Into Site Selection.
The “one-warehouse-to-rule-them-all” model is fading. Companies are prioritizing:
-
diversified supply chains
-
redundancy for data centers
-
alternative energy and green energy compatibility
-
proximity to labor pools and transportation
These are not fringe concerns anymore—they are corporate imperatives.
5. Consider Embedded Flexibility in Leases.
Shorter terms, contraction options, and expansion rights are back on the table. In a market with high rents and tight availability, flexibility is a form of insurance.
6. Use Market Intelligence to Negotiate Concessions.
Landlords may be holding the line on rents, but the moment your engagement sends a signal to the market, you’ll find:
Your advantage comes from knowing where the landlord’s pain points really are.

Zooming Back Out: How NYC Fits Into the National Industrial Story
Stepping outside New York for a moment, the national landscape is dominated by similar crosswinds:
-
Some markets showing positive absorption, others posting negative absorption.
-
New construction slowing across the country.
-
Manufacturers ramping up in select regions fueled by federal incentives like the Big Beautiful Bill Act (yes, it’s a working title people are actually using).
-
Shifts in trade policies affecting inventory strategies and operations.
-
Large amounts of new space delivered in 2022–2023 finally working through the system.
-
Corporate occupiers balancing the reality of policy uncertainty with the necessity of long-term planning.
For executives running multi-market portfolios, the message is consistent: Stay informed, stay flexible, and assume that the industrial sector will remain tight—even as demand ebbs and flows.
Final Takeaway: The NYC Industrial Market Isn’t Cooling—It’s Maturing
Q3 2025 was not a boom quarter. It wasn’t supposed to be. What it was, however, is a snapshot of a market finding equilibrium after an unprecedented run.
For tenants, the outlook is surprisingly favorable:
-
No race-to-the-bottom bidding wars.
-
Real opportunities for negotiation.
-
Strategic optionality in both core and adjacent geographies.
-
The ability to re-align footprints with long-term operational goals.
But don’t mistake opportunity for abundance. The fundamental truth of the NYC industrial market hasn’t changed:There’s still far more demand than supply—just momentarily taking a breath. For corporate leaders planning 2026 and beyond, now is the time to lock in space, maximize flexibility, and design operational frameworks that can withstand whatever the next chapter of the industrial sector brings. Because if history is any guide, the next surge in demand isn’t a matter of “if”—it’s a matter of which quarter it hits.
And in a market where leasing cools one quarter, rents hold firm the next, and supply barely trickles in, the companies winning are the ones with the best information—not the most time or the largest footprint.That’s where REoptimizer® and CRESiteIQ® come in.
REoptimizer® gives corporate tenants the ability to model scenarios, compare markets, and quantify the operational impact of everything from rent growth to supply chain shifts—long before a lease hits renewal.
CRESiteIQ® delivers real-time market intelligence across key industrial markets, tracking shifts in vacancy, absorption, construction, and pricing so you can anticipate change instead of react to it.
Together, they turn market volatility into strategic clarity—helping large occupiers negotiate smarter, plan earlier, and align real estate decisions with the future of their operations. Learn more about how they level up your portfolio today.
Learn More
