The technology displacing workers is also, for now, driving one of Manhattan’s strongest leasing recoveries in a decade.
AI firms signed more than 100 leases across Manhattan in 2025 — a 60% jump from the prior year — adding roughly 1 million square feet of office space. Legacy tech firms investing in their own AI capabilities added another 2.1 million. The result: Manhattan’s best leasing year since 2014.

For commercial real estate professionals, the numbers are a welcome reprieve after five years of elevated vacancies and tepid demand from the tech sector. But the boom rests on an uncomfortable paradox. The companies driving this office revival are building tools explicitly designed to reduce reliance on human labor — and the market knows it.
For corporate real estate portfolios, this is a structural market shift with direct implications for supply, pricing power, and long-term space strategy.
The Numbers: A Market in Transition
The scale of AI-driven leasing activity is hard to overstate. Consider the activity across Manhattan alone in 2025:
| Metric |
Figure |
Context |
| AI firm leases signed |
100+ |
+60% YoY |
| AI square footage added |
~1M sq ft |
+152% from 2024 |
| AI sq ft currently sought |
1.4M sq ft |
Active in market |
| Legacy tech sq ft added |
2.1M sq ft |
AI-driven expansion |
| Average AI rent PSF |
$88 |
vs. $78 citywide avg |
| Peak AI deal |
$210 PSF |
Select trophy assets |
| Tech share of top 20 leases |
~33% |
Up from ~10% prior year |
Headline deals include Harvey AI absorbing more than 185,000 square feet at One Madison Avenue — fully occupying a building that had struggled since its 2023 redevelopment — and OpenAI leasing roughly 90,000 square feet in SoHo for its first New York office.

Anthropic is actively seeking to expand its Manhattan footprint. Elise AI is moving into the former Tiffany building with a 50%-plus expansion. Even Palantir, whose co-founder made headlines for his sharp criticism of Mayor Zohran Mamdani, is reportedly seeking additional space in the city.
“Every industry and company is thinking about how to implement AI technology, and New York is ground zero for that conversation. And every company is here. — Julie Samuels, CEO, Tech:NYC”
Why New York — and Why Now
New York is the second-largest tech hub behind the Bay Area, but several structural shifts have accelerated its AI moment:
- NYC accounts for more than 9% of the country’s AI workforce, leading Seattle, Boston, and Los Angeles.
- Overall tech employment across the five boroughs grew 12% from 2020 to 2024, with an additional 13% projected by 2029 (JLL Research).
- The number of tech firms in Manhattan rose 21% from 2020 to 2024.
- New York boasts more than 8,750 startups — more than San Francisco — and posted more than 25,000 AI-related job openings in 2025, a national high (Tech:NYC / Center for an Urban Future).
- San Francisco remains crowded and expensive; New York offers access to capital, financial sector clients, and a deeper talent pool across verticals.
The cascading effect on submarkets is already visible. As premier Midtown addresses tighten, AI tenants are pushing into previously overlooked districts.
Scale AI relocated from Chelsea to the Financial District after its headcount doubled to 500. Topline Pro, an AI-powered platform for home services companies, chose a converted industrial building in Williamsburg, Brooklyn — deliberately positioning near where employees live and requiring five days per week in-office. Ramp, the financial tech firm, is adding two floors near Madison Square Park.
The Counterforce: AI as an Office Demand Destroyer
For Fortune 1000 occupiers, the current narrative deserves scrutiny. The same firms leasing space today are explicitly building tools designed to reduce human labor. That tension is already visible in equity markets.
Shares of SL Green Realty Corp. and Vornado Realty Trust, two of Manhattan’s largest office landlords, have declined in 2026 in part due to investor concern about AI’s long-term impact on office demand. The market is pricing in a scenario where today’s leasing cycle is real but finite — and where the efficiency gains driving AI growth ultimately compress the headcount that justifies corporate footprints.
For large occupiers managing multi-million-square-foot portfolios across multiple markets, the risk calculus is significant:
- Workforce compression from AI automation may reduce long-term headcount — and with it, the space required to house it
- Lease commitments signed today at premium rents may not align with headcount 5-7 years forward
- As AI tenants drive up asking rents in secondary submarkets, large occupiers face rising renewal and relocation costs
- Landlords are leveraging tight conditions to push longer terms and higher TI structures, increasing portfolio inflexibility
- Sectors most exposed to AI disruption — legal, financial services, professional services — are also the heaviest Manhattan office users
The irony is pointed: corporations deploying AI to reduce costs may simultaneously be absorbing higher occupancy costs driven by AI companies hiring aggressively. Both forces are operating in parallel, and the net effect on portfolio strategy remains unresolved.

Pricing Pressure: What the Data Says About Rents
The tightening is translating directly into rent escalation — particularly in the trophy and near-trophy segment. As of 2025:
- Citywide average asking rent: $78 per square foot
- AI firm average rent paid: $88 per square foot — a 13% premium over market
- High-water mark in AI deals: $210 per square foot
- Most sought-after addresses: $300+ per square foot
- Venture-backed real estate in AI corridors (Little Italy, SoHo, Flatiron): reported 40% rent increases since 2022 in some buildings
For tenants approaching lease expirations in high-demand submarkets, these figures are not abstract. Landlords with leverage will push — and most tenants are negotiating without complete visibility into what comparable deals are actually closing at, not just what is being marketed.
What This Means for Corporate Occupiers
The current market creates a specific challenge for large corporate tenants: conditions are tightening faster than most portfolio strategies anticipated, and the data asymmetry between landlords and tenants has never been greater.
Landlords and their brokers have access to full transaction data across every comparable deal in a submarket. Most tenants — even those with sophisticated in-house CRE teams — are working from marketed asking rents, anecdotal comps, and broker-curated comparables. That gap has a dollar value, and in the current environment, it is substantial.
The most important questions for Fortune 1000 occupiers in this market are not strategic. They are transactional:
- What did the comparable tenant in the same building pay — not what was listed, but what was executed?
- What free rent, TI allowances, and concession structures are landlords actually granting in this submarket right now?
- Is the proposed rent above or below where deals are actually clearing in this asset class and location?
- What does the forward supply pipeline look like in 18–36 months — and does it shift leverage?
The difference between knowing what tenants should pay and knowing what they are paying is the difference between a market-rate deal and an above-market one. In the current environment, the gap can represent millions of dollars over a lease term.
STOP NEGOTIATING BLIND
Know What You Should Be Paying — Before You Sign
REoptimizer® is the first CRE transaction management platform built specifically to close the data gap between tenants and landlords. Powered by AI and trained on over 8,000 data points per transaction, REoptimizer® doesn’t tell you what you should pay — it tells you what you are paying relative to what deals are actually closing at, right now, in your market.
In a market where AI companies are setting new rent ceilings and landlords have more leverage than they have in a decade, data parity isn’t a nice-to-have. It’s a negotiating requirement.
REQUEST A DEMO
Request a Demo
In the current labor market, a quiet but profound shift is taking place. While “restructuring” and “streamlining” are the headlines, the complete reality is a structural technological disruption driven by artificial intelligence. This isn’t just about productivity gains; it’s a fundamental change in how companies calculate their need for human capital and, by extension, office space.
Recent data from 2025 and early 2026 shows that artificial intelligence loss of jobs is no longer a theoretical risk—it is a measurable trend. Tech giants and financial institutions are trading human headcount for AI infrastructure, leading to a new economic formula: fewer employees, more AI models, and significantly smaller office footprints.

Recent College Graduates and the “First Kill Zone”
The AI revolution is not affecting all workers equally. Recent labor statistics show a “white-collar bloodbath” concentrated among recent college graduates and early-career workers. Research indicates that junior positions are shrinking at businesses integrating AI automation. This technological change hits the “First Kill Zone” hardest: roles defined by repetitive tasks and structured workflows that once served as the “bottom rungs” of the career ladder.
“We are seeing the ‘hollowing out’ of the entry-level tier. Companies are no longer hiring five juniors to find one star; they are hiring one star equipped with an AI agent.” — Sector Analysis, 2025 Global Workforce Report.
Software Development: Smaller Teams, Fewer Desks
The classic model of massive engineering departments occupying multiple floors is dissolving. Software development is seeing significant job displacement as AI agents move from simple code completion to full-scale architecture.
- Efficiency Gains: Tools like GitHub Copilot and Amazon CodeWhisperer allow a single developer to do the work that previously required a small team.
- Space Impact: Projects that once justified 50-person “bullpens” are now being handled by 10-person specialist pods, leading to immediate office contraction.
- Junior Hiring: Many firms are reducing their intake of entry-level developers, preferring a lean team of senior staff who can audit AI-generated code.
Legal and Compliance: The End of the Associate Army
In the legal sector, the “army of junior associates” once required for document review and research is being replaced by sophisticated AI platforms.
- Research Speed: AI models like Harvey can parse thousands of NDAs and case files in seconds, a task that used to take weeks of human labor.
- Headcount Reduction: When one platform does the work of 20 junior associates, the need for large Manhattan or D.C. office suites disappears.
- Lease Risks: Law firms often hold long-term, expensive leases; AI is making the square footage per partner metric look increasingly bloated.
Bank Tellers and Finance: The Automation of Logic
Bank tellers and routine accounting staff are facing a new wave of job losses as structured data meets automated logic.
- Reconciliation: AI now handles account balancing, anomaly detection, and routine reporting before a human even logs in.
- Branch Closures: The shift toward digital-only interactions has rendered traditional bank branches and regional finance hubs obsolete.
- Departmental Shrinkage: Finance departments that once required 100 people are right-sizing to 30-40 specialists, leaving vast amounts of “shadow vacancy” in their office portfolios.
The World Economic Forum predicts that by 2030, over 200,000 U.S. accounting jobs will vanish due to AI-driven reconciliation.
Customer Support: The Death of the 500-Seat Floorplate
Customer support centers were once a primary driver of suburban office demand. Today, they are the primary example of the job market being reshaped by AI agents. Klarna revealed its AI assistant performed the work of 700 full-time agents, handling two-thirds of customer service chats in its first month.
- Tier 1 Resolution: AI chatbots and voice agents now resolve up to 95% of routine queries, including refunds and scheduling.
- Footprint Collapse: Companies no longer need massive call centers with break rooms and parking lots when the majority of the “workforce” exists on a server.
- Outsourcing Shifts: Even offshore BPO hubs are seeing a decline in demand as companies bring support back in-house via localized AI models.

Job Displacement and the Commercial Real Estate Disruption
The potential for widespread displacement has a direct, evolving impact on commercial real estate (CRE). For decades, employers leased space based on headcount. Today, AI adoption means a firm can double its output while eliminating half of its physical desks.
- Shrinking Floorplates: Companies like Amazon and UPS have confirmed thousands of layoffs as they shift capital toward AI products. The demand is moving from “seats for people” to “racks for servers.”
- The Rise of the “Jewel Box” Office: Organizations are exiting massive, automated back-office cubicle farms in favor of smaller, high-quality “collaboration hubs.”
- Early Signs of Distress: Class B and C assets in cities that once relied on healthcare admin and insurance support are seeing record-high vacancies as those jobs lost to automation do not return.
Amazon recently confirmed an additional 14,000 layoffs as it shifts over $100 billion in capital expenditures toward AI products and logistics tech.
Artificial Intelligence: Navigating the New Job Market
As technological innovation creates new occupations in AI oversight, it simultaneously renders legacy employment models obsolete. To avoid being locked into a firm’s past, occupiers must treat their future real estate as an elastic asset. In the current job market, the square footage requirements of 2026 are fundamentally different from those of 2020.
- Renegotiate on Reality: Use recent data on your AI-driven headcount projections to right-size now.
- Focus on Flexibility: Shift to 3-5 year terms. In an economy where a single department can be automated overnight, a 10-year lease is a significant risk.
- Audit the “Kill Zones”: Identify which departments are seeing the highest risk of displacement and reduce those specific square footages first.
How REoptimizer® Keeps You Ahead
The AI revolution moves faster than typical cyclical downturns. To stay competitive, you need more than just general labor statistics—you need a process to identify excess space before it becomes a liability.
REoptimizer® provides the real-time intelligence needed to model workforce changes and negotiate from a position of strength. Don’t let your portfolio be defined by job losses; define it by the productivity gains of a leaner, smarter organization.
Book a demo today to see how AI and REoptimizer® can revolutionize your portfolio.
Book a Demo
In the current commercial real estate landscape, the traditional lease audit is evolving. High-level corporate tenants are no longer just looking at their own square footage; they are looking at the property’s profitability.
For a tenant in a high-rise office or a sprawling warehouse, the landlord’s net operating income (NOI) is the heartbeat of the building. If that heartbeat flutters, your services—from security to climate control—are the first to suffer. Understanding how to calculate net operating income is no longer just for commercial real estate investors; it is a critical survival skill for portfolio managers.
Net Operating Income: The Tenant’s Risk Barometer
Net operating income is a fundamental valuation metric that measures a property’s income after deducting operating expenses but before financing and taxes. For a tenant, a healthy net operating income noi signifies a landlord who has the liquidity to reinvest in the building. Conversely, a shrinking NOI suggests a landlord who may be forced to cut corners on property management and essential operating costs.
Formula of Net Operating Income
To understand the financial health of your building, you must look at the formula of net operating income. At its simplest, the net operating income formula is:
NOI=Gross Operating Income−Total Operating Expenses
While real estate investors use this to determine property value, tenants should use it to gauge operational performance. If the operating expenses are being artificially suppressed to prop up the NOI, the “deferred maintenance” bill is quietly growing—and you will eventually pay it through poor service or emergency escalations.

Gross Operating Income: More Than Just Tenant Rents
The first step in the noi calculation is determining the gross operating income. This represents the total revenue the property generates if it were fully functional, minus vacancy losses.
Gross income includes:
-
Tenant rents: The primary rental income.
-
Ancillary income: Revenue from parking fees, laundry services (in flex/mixed-use), and communications infrastructure.
-
Additional income: Vending, signage, and other revenue generated by the asset.
A landlord struggling with revenue growth in tenant rents may become aggressive with ancillary income or “nickel-and-diming” tenants on administrative costs.
Calculate Net Operating Income: Peeling Back the Expenses
To calculate NOI accurately, you must understand what qualifies as an actual cash expense. To arrive at the actual NOI, the property owner subtracts total operating expenses from the gross income.
Common operating expenses include:
-
Property taxes and income taxes (where applicable).
-
Property management fees and maintenance fees.
-
Insurance and utilities.
-
Operating costs for common areas.
Crucially, net operating income does not include financing costs, debt payments, interest payments, or capital expenditures. This is where tenants get tripped up: a building can have a “positive” net operating figure while still being in a cash-flow crunch due to high interest rates on its loan payments.
Net Income vs. Net Operating Income
It is vital to distinguish between net operating results and net income. While net operating income focuses on the property’s ability to generate cash flow from operations, net income is the “bottom line” after all business expenses, including interest expense and debt service payments.
If a landlord’s net income is negative despite a positive NOI, the property is likely over-leveraged. REoptimizer® helps you spot these discrepancies by comparing your building’s financial efficiency against comparable properties in the property’s market.

Cap Rate: How NOI Dictates Property Value
The cap rate (or capitalization rate) is the link between net operating performance and market value.
Cap Rate=Purchase Price (or Market Value)NOI
For the tenant, the cap rate is a signal of risk. A very high cap rate compared to the property type average may indicate a “value-add” property where the landlord is desperately trying to calculate noi increases by slashing property’s operating expenses. This often leads to a decline in operational efficiency and a poor tenant experience.
Calculate NOI to Predict Tenant Improvement (TI) Capacity
One of the most practical reasons to calculate net operating income is to assess a landlord’s ability to fund tenant improvements.
If the NOI calculation example for your building shows a tightening margin, the landlord likely lacks the net profit to offer competitive TI packages. They may even struggle to fund capital expenditures like elevator modernizations or HVAC overhauls, which are not included in noi but are essential for actual profitability.
Managing Multiple Properties with REoptimizer®
In a large-scale portfolio, manually reviewing the income statements for every rental property is impossible. This is where REoptimizer® becomes your most valuable asset. Our software allows you to:
-
Benchmark Operational Performance: Compare the operating profitability of your landlords across multiple properties.
-
Flag NOI Instability: Automatically detect if total operating expenses are out of sync with market trends.
-
Audit Property Management Fees: Ensure you aren’t overpaying for management fees that aren’t translating into operational efficiency.
-
Visualize Cap Rate Compression: Understand how property value shifts affect your landlord’s ability to maintain the investment property.
The REoptimizer® Advantage: Beyond the Spreadsheet
Don’t let your commercial real estate strategy be dictated by a landlord’s hidden financial strain. By understanding the formula of net operating income and utilizing REoptimizer® to monitor noi calculation trends, you shift the power dynamic back in your favor.
Are you ready to audit your portfolio’s true risk?
REoptimizer® provides the tools to see through the gross income and find the actual cash expense realities of your landlords. We help you identify the “red zone” properties where operating income is insufficient to support long-term property’s profitability.
Book a demo today for a data-driven portfolio review. Let us show you how to use NOI insights to secure better lease terms and protect your operational future.
For the Fortune 500 real estate director, a lease is more than a right to occupy; it is a long-term liability that requires active hedging. Central to this hedge is the expense stop, a mechanism that defines the boundary between a predictable overhead and an escalating variable cost.
The expense stop is the pivot point of this risk. It is a contractual provision that sets a maximum limit on the landlord’s operating expenses.
While it serves to provide a predictable “floor” for the landlord’s contribution, it simultaneously functions as a latent liability for the tenant. For the sophisticated occupier, understanding the interplay between the base year, actual expenses, and annual increases is the difference between budget stability and an unexpected multi-million dollar hit to the EBITDA.

Expense Stop: The Landlord’s Hedge and the Tenant’s Exposure
An expense stop in commercial real estate is essentially a risk-transfer mechanism. It is primarily used in Full-Service Gross Leases to protect landlords from rising costs while providing tenants with a predictable initial rent. By setting a certain amount—typically expressed per square foot—the landlord caps their financial liability.
From the landlord’s perspective, this provision ensures predictable cash flow. The risk of rising inflation, sudden spikes in utility costs, or labor increases for building expenses is transferred to the tenant.
If the actual operating expenses rise to $12 per square foot while the expense stop amount is set at $10, the tenant is responsible for the $2 difference. On a 100,000-square-foot headquarters, this “minor” fluctuation results in a $200,000 unbudgeted expense.
However, the expense stop is not inherently predatory; it can provide predictability for tenants in terms of operating expenses, allowing them to budget effectively for the first year. The risk, however, is that if the initial stop is set artificially low during lease negotiations, the tenant may be exposed to large, immediate increases in subsequent years.
Base Year: Defining the Economic Baseline
The base year is the chronological anchor of a commercial lease. While it can be any year agreed upon, it is typically the first year of the lease term. In a full service or modified gross lease, the landlord pays for all operating expenses incurred during this period. The actual amount of expenses tied to this window becomes the “floor” for the remainder of the term.
For the C-suite, the base year amount is a critical data point. If a tenant signs a lease in a building that is only 50% occupied during the base year, the actual expenses will be deceptively low. As the building fills and occupancy reaches 95%, the variable expenses—such as janitorial services, utilities, and property management fees—will skyrocket.
Without proper lease protections, such as a “Gross-Up” clause, the tenant will face significant rent increases simply because the landlord was successful in leasing the rest of the building. A sophisticated new lease negotiation must ensure the base year is adjusted to reflect a fully occupied building, creating a “realistic base year” that prevents unfair spikes in the second year and beyond.

Operating Expenses: The Anatomy of “Additional Rent”
To manage a large-scale portfolio, one must look beyond the total sum and analyze the components of building operating expenses. These generally include:
- Property Taxes: Often the largest and most volatile uncontrollable expense.
- Insurance: Subject to global market shifts and climate-related adjustments.
- Common Area Maintenance (CAM): The costs of operating shared lobbies, elevators, and parking structures.
- Property Management Fees: Usually calculated as a percentage of gross revenue.
In a full service lease, the tenant benefits from the landlord’s management of these services, but they assume the risk of any operating costs that exceed the specified expense stop. This can lead to significant, unexpected increases in total rent.
Conversely, in a net lease, the tenant pays their pro rata share of all expenses from day one. While a net lease offers more transparency, the gross lease with an expense stop is often preferred by large corporations for the initial budget certainty it provides, provided the base year stop is negotiated aggressively.
Commercial Real Estate Portfolio Strategy: Mitigation and Negotiation
A Fortune 500 tenant must approach commercial real estate leases with a defensive mindset. Because the risk of unexpected increases in property expenses is transferred to the tenant—supporting the stability of the landlord’s investment—the tenant must negotiate counter-measures.
- Negotiating the Expense Cap: While the expense stop limits the landlord’s downside, a sophisticated tenant will negotiate for an “expense cap.” This is a secondary ceiling that limits how much the tenant’s pro rata share can increase year-over-year. For example, capping annual increases on controllable operating expenses (like landscaping or security) at 5% ensures that the landlord has an incentive to manage the property efficiently.
- The Power of Audit Rights: Many tenants fail to exercise their right to verify actual expenses. Tenants should negotiate robust audit rights to ensure accuracy in the landlord’s operating expense statements. Requesting an annual audit prevents the landlord from passing through capital expenditures (which should be the landlord’s cost) as common area maintenance.
- Understanding the Base Year Lease vs. Expense Stop Amount: It is a common misconception that all commercial leases handle increases the same way. In a base year lease, the tenant is responsible for any increase in operating expenses over the actual expenses of the first year. In a lease with a fixed expense stop amount, the dollar figure is hard-coded (e.g., $10.00/SF). If the building’s actual expenses in the first year are already $11.00/SF, the tenant is effectively paying overages from the moment they move in.
Common Area Maintenance: The Friction Point
The common area maintenance (CAM) section of a lease is where most disputes arise. For a large-scale office building, CAM includes everything from HVAC maintenance to the flowers in the lobby.

Sophisticated tenants must scrutinize the definition of CAM to exclude:
- Executive salaries of the landlord’s personnel.
- Marketing costs for vacant spaces.
- Costs associated with other specific tenants’ modified gross leases.
- Taxes and insurance that should be itemized separately to ensure they are not being marked up by management fees.
By tightening these definitions, the tenant ensures that the difference they pay between the actual expenses and the base year stop represents legitimate, market-rate increases rather than landlord inefficiencies.
From Strategy to Execution: Optimizing with REoptimizer®
The most critical insight for a C-suite executive is that an expense stop is not a static figure; it is a dynamic risk that requires continuous monitoring. For organizations managing a high-volume, large-scale portfolio, manual tracking in spreadsheets is an invitation for budget leakage and missed audit windows.
To turn real estate from a passive expense into a strategic asset, forward-thinking tenants leverage REoptimizer®, a cloud-based transaction and lease management platform designed specifically for corporate tenants.
How REoptimizer® Protects Your Bottom Line:
- Centralized Expense Clarity: REoptimizer® acts as a single source of truth, centralizing all lease documents and abstracting critical data points like your base year stop, expense caps, and audit rights.
- Automated Anomaly Detection: The software provides instant visibility into overspending. By benchmarking your actual operating expenses against market data and previous years, REoptimizer® identifies red flags—such as “spiking” variable costs or miscalculated pro rata shares—before they become permanent losses.
- Audit Readiness: When it’s time to exercise your audit rights, REoptimizer® ensures you have the historical data and line-item clarity needed to hold landlords accountable, ensuring you aren’t paying for capital improvements or non-allowable CAM charges.
- Strategic Decision Support: Using interactive dashboards and AI-powered data mapping, REoptimizer® allows you to simulate “what-if” scenarios. You can see the long-term impact of rising property taxes or inflation on your entire portfolio’s occupancy costs years in advance.
Take Control of Your Portfolio Today
Don’t leave your corporate real estate budget to chance or landlord-favorable estimates. Whether you are negotiating a new high-rise lease or auditing a global portfolio, the right technology is your best defense.
Ready to see what you should be paying?
Schedule a Demo of REoptimizer® today to discover how our patented technology can identify inefficiencies, lower your CRE spend, and provide the transparency your C-suite demands.
Book a Demo
A lease is more than just a contract for space; it is a multi-million dollar bet on your landlord’s financial stability. Whether you are managing a global warehouse network or a large-scale office portfolio, your operational continuity depends on the person across the table. And in today’s volatile market, the most critical “inspection” isn’t of the brick and mortar—it’s of the debt service coverage ratio (DSCR).
If your landlord is facing financial strain, your “Class A” experience can quickly dissolve into deferred maintenance, tax liens, or even the nightmare of a mortgage loan foreclosure. Here is how sophisticated real estate investors and corporate tenants use DSCR to protect their interests and why REoptimizer® is the essential tool for flagging these risks before they become your problem.

What is DSCR (Debt Service Coverage Ratio)?
The Debt Service Coverage Ratio (DSCR) is a financial metric used by many lenders to determine a borrower’s capacity to repay a loan. In simple terms, DSCR measures whether the property generates enough cash flow to cover loan payments.
For a tenant, the landlord’s DSCR is a barometer for their ability to maintain the property. If the ratio is too low, the landlord is likely “robbing Peter to pay Paul”—diverting your monthly rent to cover current debt obligations instead of essential operating expenses.
How to Calculate DSCR
To calculate DSCR, you divide the property’s net operating income (NOI) by its total debt service:
DSCR=Total Debt ServiceNet Operating Income (NOI)
- Net Operating Income (NOI): This is the rental income minus operating expenses (such as taxes, insurance, and maintenance).
- Total Debt Service: This includes all principal and interest payments on the mortgage loan.
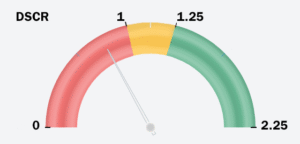
Benchmarks: What is an “Acceptable DSCR”?
Understanding the numbers is the first step in identifying financial difficulties in your landlord’s portfolio.
- DSCR > 1.25: This is the common industry standard for most real estate investors. It means the property generates 25% more income than is needed to cover loan payments.
- DSCR = 1.0: The property is just breaking even. One major vacancy or a spike in the annual interest rate could push the property into the red.
- DSCR < 1.0: A low DSCR indicates that the rental property’s cash flow is insufficient to cover mortgage payments.
The “Office Trap”: Why Office Tenants Face Higher Risk
For the office sector, a standard 1.25x DSCR is a starting point. Because office buildings have high tenant concentration and massive down payments required for tenant improvements (TIs), lenders often demand a minimum DSCR of 1.35x to 1.40x to approve an office mortgage loan.
The NOI Cash Flow Crisis
In the office world, Net Operating Income (NOI) is under siege. Unlike warehouse spaces with triple-net (NNN) leases that pass most costs to the tenant, office landlords often bear the brunt of:
- Skyrocketing Insurance Premiums: Insurance is a primary operating expense that has jumped 20–40% in some urban markets.
- Capital Expenditure (CapEx) vs. NOI: Standard DSCR calculation methods often exclude CapEx. However, an office landlord must spend heavily on lobbies and “amenitization” to attract tenants. If they are spending their cash on debt instead of CapEx, your building is effectively “dying on the vine.”
The Danger of Cross-Collateralization with a DSCR Loan
This is the “invisible” threat for a corporate tenant. Many large-scale office landlords use cross-collateralization, where multiple properties serve as collateral for a single mortgage loan (often called a blanket mortgage).
- The Scenario: Your office building might have a “healthy” individual DSCR of 1.30x.
- The Risk: If your landlord’s warehouse in another state loses its anchor tenant and its DSCR drops to 0.80x, the lender can trigger a cross-default.
- The Result: The lender could seize your building even if its performance is perfect. This “portfolio contagion” is why you must look beyond the single asset to the borrower’s capacity across their entire holdings.

Strategic Management: How to Audit Your Landlord
While you may not always have access to a landlord’s private tax returns, you can use the following factors to estimate their DSCR calculation:
- Analyze Market Rents: Use monthly rental income data for the property’s location to estimate the revenue.
- Monitor Tenant Turnover: If an office building has 20% of its leases expiring in the same period, the NOI is at extreme risk, which will tank the DSCR.
- Review Loan Terms: Research when the property was purchased. Loans from 2021 with low interest rates are now facing “refinancing cliffs” where the new annual interest rate will double the monthly payments.
Don’t Let Their Debt Become Your Disaster
In the current market, a strong DSCR is the ultimate sign of a reliable landlord. As a corporate tenant, you have the responsibility to understand the financial health of the entities housing your operations.
Are you ready to see the hidden risks in your CRE portfolio?
Stop guessing and start optimizing. REoptimizer® is the only transaction management software built to give corporate tenants an “institutional-grade” look at their landlords’ financial health. We don’t just help you manage leases; we help you audit the entities behind them.
Why REoptimizer® is Your Ultimate Shield:
- The Landlord Watchlist: Our platform flags landlords who are under financial strain based on real-time market data, debt maturity “cliffs,” and historical performance.
- Red & Yellow Flag Alerts: Instantly see which properties in your portfolio have a low DSCR or rising operating expenses that could trigger a service lapse.
- Cross-Collateralization Mapping: We reveal the hidden links in your landlord’s debt. If your warehouse is cross-collateralized with a failing office tower, REoptimizer® puts that risk on your dashboard before the lender sends a default notice.
- NOI Stress Testing: See how your building’s Net Operating Income holds up against shifting interest rates and inflation, giving you a clear picture of your borrower’s capacity.
Contact REoptimizer® today for a free portfolio health check. See exactly how our software can identify cross-default risks, flag high-risk debt obligations, and save you millions in hidden operational disruptions. Book a demo to see the difference it can have on your portfolio today.
Book a Demo
Frequently Asked Questions: Navigating Landlord DSCR Risk
For corporate tenants, the financial health of a landlord is just as important as the physical health of the building. Below are the most common questions regarding the debt service coverage ratio and how it impacts your investment decisions.
How do you use the DSCR formula for a commercial landlord?
To perform a dscr calculation on a potential landlord, you need to estimate the building’s Net Operating Income (NOI) and divide it by the total debt service. While you may not have their exact ledger, you can use a dscr calculator approach by researching:
- Revenue: Estimated monthly rental income based on the building’s square footage and current market rates for the property’s location.
- Expenses: Standard operating expenses (usually 25–35% of gross income for office/warehouse) including taxes, insurance, and maintenance.
- Debt: Estimated principal and interest payments based on the property’s last recorded loan amount and the prevailing interest rate at the time of financing.
What is considered an acceptable DSCR for office vs. warehouse properties?
While many lenders accept a minimum DSCR of 1.25x for general investment property, the “safety zone” varies by asset class:
- Warehouse/Industrial: Because these often have stable, long-term NNN leases, a ratio of 1.20x to 1.25x is typically an acceptable DSCR.
- Office Space: Due to higher tenant turnover and the massive down payment required for tenant improvements (TIs), savvy tenants look for a landlord with a DSCR of 1.35x or higher. Anything lower suggests the landlord may lack the liquidity to fund your next office build-out.
How does a high interest rate impact a landlord’s debt service?
The annual interest rate is the most volatile component of the dscr formula. If a landlord has a floating-rate mortgage loan or an upcoming “refinancing cliff,” a 2% jump in the interest rate can instantly drop a healthy 1.30x DSCR to a sub-1.0 financial strain level. This is why REoptimizer® tracks market cycles—to warn you when your landlord’s borrower’s capacity is shrinking.
Can I use a DSCR loan calculator to estimate landlord risk?
Yes. A dscr loan calculator is a great “reverse engineering” tool. By inputting the property’s estimated value and the current loan to value (LTV) ratios, you can determine the maximum debt service the property can handle. If the resulting monthly payments are nearly equal to the estimated monthly rent, the landlord has zero margin for error.
What are the “other factors” that can tank a property’s DSCR?
Beyond the basic dscr calculation, tenants should watch for:
- Cross-Collateralization: If your office building is tied to a struggling retail mall in the same mortgage loan pool.
- Soft Market Conditions: Rising vacancy rates in the same period that expenses like insurance and taxes are increasing.
- Capital Expenditures: One-time costs (like a roof replacement) that aren’t in the NOI but drain the cash needed to repay the loan.
Proactive Portfolio Protection
In the high-stakes world of corporate CRE, information is your only shield. Don’t wait for a “For Sale” sign or a lapse in building services to realize your landlord is in trouble.
REoptimizer® gives you the data-driven edge to:
- Flag High-Risk Landlords: Identify owners with low DSCR and heavy debt obligations.
- Optimize Deal Terms: Use landlord financial weakness as leverage for better lease protections.
- Centralize Portfolio Health: See all your office and warehouse risks in one interactive dashboard.
Learn More
The headlines of the last few years have vacillated between “the office is dead” and “the Great Return.” However, for corporate tenants managing large-scale, complex portfolios, the reality is far more nuanced. As we move into 2026, the data reveals a landscape defined not by a universal recovery, but by regional divergence and the solidification of a “new seasonal norm.”
According to recent data from Placer.ai, December 2025 marked the busiest holiday-season office month since the pandemic. Yet, national attendance remains 33.1% below 2019 levels. For the modern real estate executive, this isn’t just a statistic—it’s a signal to rethink footprint strategy, lease expirations, and the technology used to manage them.

The Bifurcation of the American Office Market
The recovery is not happening at the same speed everywhere. If your portfolio spans from Miami to San Francisco, you aren’t managing one real estate strategy; you’re managing two different worlds.
The Leaders: Sunbelt and Financial Hubs
The “flight to quality” and “flight to the sun” are no longer just theories. The top-performing markets have one thing in common: business-friendly environments and a high concentration of industries that value face-to-face interaction.
-
Miami (-10.9% from 2019): Miami remains the gold standard for office recovery. With the smallest gap in the nation, the “Wall Street South” movement has proven to be durable rather than a temporary migration.
-
Dallas (-18.8% from 2019): A powerhouse for corporate relocations and a hub for diversified logistics and finance, Dallas continues to outperform the national average significantly.
-
New York (-19.6% from 2019): Despite the high cost of living, NYC’s financial core has pulled the city back toward the 80% recovery mark, driven by aggressive return-to-office mandates from major banking institutions.
The Laggards: Tech Hubs and Urban Cores
On the opposite end of the spectrum, cities heavily reliant on the tech sector or those with long commute times continue to struggle.
-
Chicago (-47.6%): The widest gap in the nation, suggesting a fundamental shift in how the Midwest’s largest business hub utilizes its downtown core.
-
San Francisco (-44.8%): While still far from 2019 levels, San Francisco saw a staggering 17.9% year-over-year increase in 2024. This suggests a “rebound from the bottom” fueled by the AI boom.
-
Denver (-44.7%): Despite its lifestyle appeal, Denver’s office recovery has plateaued, showing only 0.6% growth year-over-year.

Understanding the “December Dip” and Seasonal Norms
Placer.ai’s latest report highlights a phenomenon called “the solidification of a new post-Covid seasonal norm.” In December 2025, visits per working day reached post-pandemic highs, yet overall attendance dipped compared to the autumn months.
For corporate tenants, this is a critical insight. The dip wasn’t a setback; it was a choice. Many employers are now easing in-office expectations during December to accommodate holiday travel.
Why this matters for your portfolio:
-
HVAC and Operations: If 30% of your office is empty for 1/12th of the year, are your building systems optimized for that vacancy?
-
Employee Value Proposition: Flexibility is becoming seasonal. If you are leasing 100,000 square feet, but your staff only utilizes 40,000 in December, the “cost per utilized square foot” skyrockets.
The Intersection of Office and Warehouse Space
For tenants managing mixed portfolios that include both high-tier office properties and massive warehouse footprints, the data suggests a symbiotic relationship.
In markets like Dallas and Miami, the strength of the office sector often mirrors the strength of the logistics sector. As more corporations move their headquarters to these hubs, the demand for regional distribution centers follows.

However, the “recovery” in these two asset classes looks very different:
The challenge for 2026 is managing the “Hybrid Creep.” As office mandates tighten, the need for integrated logistics—supporting employees who may be working from various locations—remains high. If your transaction management doesn’t account for the geographic proximity of your office talent to your warehouse operations, you are leaving money on the table.
The “Hybrid Creep” and the 2026 Outlook
Looking ahead, Placer.ai predicts a steady climb in office visits. This isn’t necessarily due to “Big Bang” return-to-office announcements, but rather “Hybrid Creep.”
This is the gradual increase of required days—from two to three, then three to four—often without a formal change in policy. This creates a “shadow demand” for space.
Critical considerations for 2026:
-
Lease Flexibility: With San Francisco and Chicago showing such volatile year-over-year swings, long-term, rigid leases are becoming liabilities.
-
Portfolio Right-Sizing: If national visits are down 33%, but your portfolio hasn’t shrunk by at least 20%, you may be over-leveraged in under-utilized assets.
-
Data-Driven Negotiations: You cannot negotiate a lease in 2026 using 2019 data. You need real-time foot traffic data and market-specific recovery metrics to push back on landlords.
Strategies for Portfolio Optimization in a Divergent Market
How should a corporate tenant respond to this data? It comes down to three pillars: Consolidation, Relocation, and Optimization.
-
Consolidate in Laggard Markets: In cities like Chicago or Denver, where recovery is stalled, tenants have the upper hand. This is the time to consolidate multiple satellite offices into a single, high-amenity “Class A” trophy space at a discounted rate.
-
Lock in Rates in Growth Markets: In Miami and Dallas, the window for “pandemic pricing” has closed. If you have upcoming expirations in these hubs, move early.
-
Leverage Technology for Transaction Management: You cannot manage a 50-property portfolio using spreadsheets. The delta between the “best” and “worst” markets is now over 35%. That margin is where your profit (or loss) lives.

Don’t Guess—Optimize with REoptimizer®
The Placer.ai data proves that the “national average” is a myth. To successfully manage a large-scale portfolio in 2026, you need granular, market-specific insights and a platform that can turn that data into actionable deals.
The complexity of today’s market—balancing office recovery trends, warehouse demand, and “hybrid creep”—requires more than just a broker. It requires a system.
REoptimizer® is the critical transaction management software designed for the modern corporate tenant. We help you:
-
Visualize Portfolio Gaps: See exactly where your space utilization lags behind market recovery trends.
-
Optimize Deal Flow: Standardize your transaction process across different regions, ensuring you get “Miami-level” precision in every market.
-
Reduce Occupancy Costs: Identify underperforming assets and execute on disposals or renegotiations before the “Hybrid Creep” makes them obsolete.
The office isn’t dead, but the old way of managing it is. In a world of 33% national vacancy gaps and 17% year-over-year surges, you need a tool that moves as fast as the market.
Ready to see how your portfolio stacks up against the latest recovery data? [Request a demo of REoptimizer® today] and start optimizing your deals for the new normal.
In 2026, volume is not the same as health. While Manhattan just posted its best leasing year since 2014, the “under the hood” data reveals a market of extreme volatility.
So, the “Manhattan Recovery” headline is a distraction. For enterprise tenants managing national portfolios, the real story in 2026 is the bifurcation of value. While Class A office leasing has hit its highest volume since 2014 (42.9 million SF), the cost of occupancy is being rewritten by unprecedented landlord concessions and industrial power shortages.
For corporate tenants with large-scale office and warehouse footprints, the goal has shifted from securing space to arbitraging the spread between landlord desperation and infrastructure scarcity.

The Office “Shadow Inventory” Reckoning
The 42.9 million square feet of signings in 2025 masks a critical metric: Net Absorption.
While firms are signing leases, they are simultaneously shedding “shadow space”—square footage that is leased but vacant.
- The Consolidation Ratio: For every 100,000 SF signed in 2025, an average of 125,000 SF was returned to the market or earmarked for disposal.
- The “Zombie” Floor: Approximately 15% of Manhattan’s “leased” space is currently underutilized. Smart tenants are using this as leverage to negotiate “early out” clauses and contraction rights that were unthinkable three years ago.
- Downtown’s Conversion Floor: The drop in Downtown availability to 19.9% is a result of “supply destruction.” When a building is slated for residential conversion, it disappears from the office supply, creating a false scarcity that landlords use to hike rents.
Industrial 2.0: The End of the “Dumb Box”
The industrial side of your portfolio is facing a different crisis: The Infrastructure Gap.
The “Great Rebalancing” means a 500,000 SF warehouse is a liability if it doesn’t have the power to support a 2026 tech stack.
The New Industrial Audit Requirements:
- Kilowatts over Square Feet: The rise of autonomous sorting and EV fleet mandates has increased power requirements by 3.5x compared to 2020. A site with a 4,000-amp service now carries a 20% valuation premium over a 2,000-amp site.
- The Speculative Hangover: There is currently a 189 million SF surplus of big-box speculative space. If your logistics provider isn’t demanding 12–18 months of free rent on 10-year deals in secondary markets, you are overpaying.
- The Resilience Premium: Onshoring has driven a 117% increase in demand for “Advanced Manufacturing” shells. These are no longer warehouses; they are high-spec hybrid facilities that require a specialized transaction approach. Read more about onshoring will affect your industrial portfolio.

The Power-Scarcity Squeeze
The convergence of AI-driven robotics and the mandatory transition to EV drayage has created a “waiting list” for energy that now dictates deal velocity more than location ever did.
- The 2-Year Interconnection Lag: In core markets like the Inland Empire and New Jersey, the lead time for a 4,000-amp service upgrade has blown out to 18–24 months. If you sign a lease on a “standard” warehouse today with the intent to automate by 2027, you may find yourself with a fleet of robots and nowhere to plug them in.
- The “Vampire” Load of Automation: A modern 500,000 SF automated hub, utilizing high-density Goods-to-Person (G2P) systems and autonomous mobile robots (AMRs), consumes up to 30 kWh per hour per heavy-duty unit. Across a fleet of hundreds, this “vampire load” creates a baseline energy requirement that can exceed the entire capacity of an older Class B facility.
- The “Microgrid” Advantage: To bypass utility delays, top-tier enterprise tenants are now prioritizing sites with on-site generation potential. In 2026, a rooftop that can support a 2-megawatt solar array paired with battery storage is no longer a “green luxury”—it’s a contingency plan for grid instability.
This infrastructure gap has inverted the traditional negotiation. You aren’t just negotiating with a landlord; you are negotiating for a slice of the local power grid. Sophisticated portfolios are moving away from “Gross” or “Triple Net” leases toward “Infrastructure-Indexed” agreements. These leases include specific guarantees on power delivery timelines and penalize landlords for utility-side delays that stall tenant occupancy.
Landlord Solvency: The New “Due Diligence”
In 2026, the most dangerous line item in your portfolio is a distressed landlord. With $2 trillion in debt maturing, your Tenant Improvement (TI) allowance is essentially an unsecured loan to a potentially insolvent entity.
- The $30 Net-Effective Spread: Landlords are artificially propping up “Face Rents” to satisfy lenders. A $90/SF lease often has a Net Effective Rent of $60/SF once you factor in the massive TI packages.
- TI Escrow as a Non-Negotiable: Sophisticated enterprise tenants are now mandating that TI funds be placed in third-party escrow accounts at lease signing. If the landlord defaults on their mortgage, your build-out capital must remain protected.
- The Service-Level Audit: Before renewing, run a 3-year CAPEX audit on the building. If the landlord has deferred elevator maintenance or HVAC upgrades to save cash, your “Class A” experience will degrade into “Class C” reality within 24 months.
Read more about how to identify a distressed landlord.
Portfolio Optimization: Moving Beyond the Spreadsheet
The complexity of the 2026 market has outpaced the capability of manual tracking. When your office footprint is contracting while your industrial power needs are exploding, you need a single source of truth.
Why REoptimizer® is Critical for 2026 Transaction Management:
To win in this “bifurcated” market, you need to see the data the landlords don’t want you to have. REoptimizer® provides the transparency required to optimize high-volume, large-scale portfolios.
- True-Cost Benchmarking: Our platform strips away the “Face Rent” illusions to show you the actual Net Effective Rents being signed in your submarket.
- Power-Grid Intelligence: For industrial assets, REoptimizer® tracks infrastructure specs, ensuring you don’t sign a 10-year lease on a building with an obsolete power profile.
- Landlord Risk Scoring: We integrate financial health data into your portfolio dashboard, flagging assets that are at risk of “Refinancing Gaps” before you commit capital.
- Transaction Acceleration: Centralize your deal flow to reduce the time-to-close by 30%, allowing you to lock in favorable concession windows before they close.
See the difference REoptimizer® can have on your portfolio today.
Learn More
2026 Portfolio Strategy: Frequently Asked Questions
Is the 2026 Manhattan office “recovery” real or a statistical anomaly?
The recovery is bifurcated. While leasing volume hit a 10-year high of 42.9 million SF in 2025, this growth is almost entirely concentrated in Class A+ and Trophy assets. For enterprise tenants, the headline “recovery” is a distraction from the reality of negative net absorption. The market is actually shrinking; for every 100k SF signed, 125k SF is being vacated. This creates a “Zombie Floor” of shadow inventory that smart tenants use to leverage high concessions.
What is “Shadow Inventory” and how does it impact my lease negotiations?
Shadow inventory refers to square footage that is technically under lease but physically vacant or underutilized. In early 2026, approximately 15% of Manhattan’s leased office space is considered “Zombie Space.”
- Tenant Leverage: Because landlords are desperate to keep these tenants from defaulting or non-renewing, you can negotiate “contraction rights” and “early-out clauses” that were previously off the table.
- Actionable Strategy: Use REoptimizer® to track your actual utilization—if your “occupied” space is only 50% full, your effective cost per employee is double your rent.
Why is warehouse “Power-Readiness” more important than location in 2026?
The industrial market has shifted from a “space” crisis to an “infrastructure” crisis. Automation and EV fleet mandates have increased power requirements by 3.5x since 2020.
- The Power Premium: A warehouse with a 4,000-amp service now commands a 20% rent premium because the lead time for utility upgrades in core markets has hit 18–24 months. * The Risk: Signing a lease on a “Dumb Box” without sufficient power can stall your automation rollout for years, making the real estate a literal bottleneck for your supply chain.
How do “Infrastructure-Indexed Leases” protect industrial tenants?
Infrastructure-Indexed Leases are a new 2026 standard for high-tech industrial users. Unlike a standard Triple Net (NNN) lease, these agreements include:
- Power Delivery Guarantees: Financial penalties for the landlord if the promised utility capacity is delayed.
- Grid-Interruption Abatements: Rent credits if the local grid cannot sustain the tenant’s documented “vampire load” from robotics.
- Microgrid Rights: Pre-negotiated rights for the tenant to install on-site solar and battery storage to bypass utility instability.
How can I protect my Tenant Improvement (TI) allowance from a distressed landlord?
With $2 trillion in CRE debt maturing by 2027, the risk of a landlord defaulting before paying out your TI is at an all-time high.
- TI Escrow: Always mandate that TI funds be placed in a third-party escrow account at lease signing.
- Face Rent vs. Net Effective: Remember that $90/SF “Face Rent” is often just a lender-friendly illusion. In 2026, the $30 concession gap means you should be pushing for $120+/SF in TI packages to offset your capital expenditure.
The San Francisco office market is entering a materially different phase than it occupied just 12 to 18 months ago. Is this the comeback no one expected?
Because while overall vacancy remains elevated, multiple leading indicators—including leasing activity, tenant requirements, net absorption, and capital reengagement—now point toward stabilization and early recovery, particularly at the high end of the market.
For corporate real estate executives and large-scale tenants, San Francisco’s trajectory matters beyond the Bay Area. Historically, the market has acted as a forward indicator for national office trends, especially in innovation-driven metros.
As the industry looks toward 2026 and beyond, the data emerging from San Francisco provides critical insight into what the next office cycle is likely to look like across the U.S. Let’s go deeper.

Leasing Activity Reflects A Fundamental Shift In Demand Composition
Leasing activity in San Francisco accelerated meaningfully in 2025, reversing several years of contraction and signaling renewed occupier engagement.
According to an industry Q4 2025 Office Leasing Market Summary:
- 10.2 million square feet of office space was leased in San Francisco in 2025
- AI companies accounted for 25% of that leasing activity
- 2.5 million square feet of space was leased by AI firms alone—the highest annual total since 2018
AI-driven leasing is largely concentrated among well-capitalized companies with long-term growth horizons, which has implications for lease duration, credit quality, and space selection.

And go figure, the same AI technologies widely expected to reduce long-term office demand are currently among the strongest drivers of leasing activity. This also mirrors the Silicon Valley Boom of early Facebook and Google days.
What’s Different This Cycle:
- Demand is highly selective, not broad-based
- Leasing is concentrated in best-in-class buildings
- Space decisions are being tied directly to innovation, collaboration, and talent strategy
For occupiers, this reinforces that office space is once again being treated as a strategic input, and a big cost worthy of appearing on a balance sheet.
Net Absorption Turns Positive For The First Time In Years
One of the most consequential data points in 2025 was the return of positive net absorption. Industry reports point to:
- 2.2 million square feet of positive net absorption in 2025
- AI companies drove 82% of that absorption (approximately 1.8 million square feet)
- The previous absorption peak was 3.9 million square feet in 2018
Positive net absorption marks a critical inflection point. It signals that leasing activity is no longer simply recycling space but is reducing overall availability—a prerequisite for any sustained recovery. This is an incredible comeback from an area choked by unprecedented vacancies and urban decline.
Why This Matters For CRE Leaders:
- Absorption typically leads vacancy improvement
- Vacancy improvement precedes pricing power
- Pricing power eventually drives asset value stabilization

Vacancy Remains Elevated—But The Direction Has Changed
Despite years of strikingly negative headlines, vacancy metrics are now moving in the right direction.
Key vacancy data from Q4 2025:
- Overall vacancy declined to 33.5%
- This represents a three percentage point year-over-year reduction
- The decline marks the largest annual vacancy improvement since 2011
It is critical to note that vacancy reduction is not uniform across the market.
- Trophy and Class A buildings are experiencing the fastest improvement
- Lower-quality and poorly located assets continue to struggle
- Submarkets with modern inventory and strong transit access are outperforming
This bifurcation reinforces the reality that the recovery is asset-specific, not market-wide. This is a national trend appearing very acutely in San Francisco.
Tenant Demand Is At A Record High—Despite Elevated Vacancy
One of the most forward-looking indicators of future performance is tenant intent, not just executed leases. Industry reports point to:
- Tenants are currently seeking eight million square feet of office space in San Francisco—an all-time high
- Approximately three million square feet of this demand represents expected net absorption growth
- AI companies account for 2.8 million square feet of active requirements
- AI firms represent 1.7 million square feet of expected net absorption
This demand exists despite more than 30 million square feet of vacant space, underscoring how quality and suitability—not raw availability—are driving decisions.
Implication For Occupiers: There is a narrowing window to secure top-tier space before competition increases and concessions begin to compress in high-demand buildings.
Capital Markets Reengage As The Bid-Ask Spread Narrows
Improving leasing fundamentals have been accompanied by renewed capital market confidence.
According to GlobeSt and market participants:
- The bid-ask spread has meaningfully narrowed
- Institutional equity and lenders are reentering the market
- Transactions are increasingly grounded in realistic pricing, not forced distress
This shift has unlocked:
- Repositioning strategies for underperforming buildings
- Acquisitions trading below replacement cost
- Renewed interest in land and selective development opportunities
Importantly, capital is no longer frozen by uncertainty—it is selectively targeting assets aligned with post-pandemic demand patterns.

San Francisco As A National Leading Indicator Heading Into 2026
San Francisco’s recovery matters because it reflects a pattern likely to repeat nationally.
Key national implications:
- Top-tier assets recover first in every cycle
- Office demand is evolving, not disappearing
- Vacancy compression will be slow, uneven, and quality-driven
- Rent growth will lag fundamentals, likely into late 2026
Markets that share San Francisco’s characteristics—deep talent pools, innovation-driven industries, institutional capital, and improving governance—are positioned to follow a similar trajectory.
Outlook: A Selective, Data-Driven Office Recovery
Looking ahead, the San Francisco office market is not poised for a rapid rebound—but it is firmly in recovery mode.
Expectations for 2026:
- Continued demand growth, led by technology and AI
- Further reductions in vacancy, concentrated in Class A assets
- Concessions to remain elevated in lower-tier buildings
- Gradual improvement in pricing and asset values
The next office cycle will reward precision, patience, and portfolio optimization—not broad exposure.
The REoptimizer® Perspective
At REoptimizer®, we view San Francisco as a case study in early-cycle recovery.
For occupiers, this market presents a rare opportunity to align long-term space strategy with favorable economics—before leverage shifts. For portfolio leaders and investors, the lesson is clear: the office is not coming back uniformly, but it is coming back strategically.
San Francisco is no longer a warning signal. It is a roadmap.
As leverage begins to shift and performance gaps widen between assets, organizations with clearly defined real estate strategies will gain a durable advantage—while others are forced into reactive decisions. This is the moment to evaluate not just where you operate, but why, how, and on what terms your portfolio supports the business.
REoptimizer® works exclusively on behalf of occupiers to strengthen portfolio performance across markets. We provide independent, data-driven advisory services that help organizations:
- Reposition portfolios ahead of market inflection points
- Optimize lease structures, timing, and capital commitments
- Reduce long-term occupancy risk while improving flexibility
- Align real estate decisions with enterprise strategy, growth, and talent objectives
Our role is not to transact—it is to help you make better decisions before the market forces your hand.
Learn how REoptimizer® can help you transform market insight into lasting portfolio strength.
Learn More
Frequently Asked Questions: San Francisco Office Market
What Is Driving The Current Recovery In The San Francisco Office Market?
The recovery is being driven primarily by technology and AI companies, improved net absorption, and renewed capital market confidence.
Key drivers include:
- 2.5 million square feet of AI leasing activity in 2025
- 2.2 million square feet of positive net absorption, with AI firms accounting for 82%
- A three percentage point year-over-year decline in vacancy, the largest since 2011
- Reengagement from institutional equity and lenders as pricing expectations realign
This recovery is selective, not broad-based, with demand concentrated in Class A and trophy office buildings.
Is Vacancy Still A Concern In San Francisco?
Yes, overall vacancy remains elevated, but the trend has shifted.
- Q4 2025 vacancy: 33.5%, down from the prior year
- Vacancy declines are asset-specific, not market-wide
- Top-tier buildings are experiencing the fastest improvement
- Lower-quality and poorly located assets continue to face challenges
For decision-makers, the direction of change is more important than the absolute number at this stage of the cycle.
What Types Of Office Space Are Seeing The Most Demand?
Demand is concentrated in high-quality, well-located office space.
Most sought-after characteristics include:
- Trophy and Class A buildings
- Modern infrastructure and efficient floor plates
- View space and strong natural light
- Locations requiring minimal tenant improvements
- Proximity to transit and amenities
This bifurcation reinforces the growing performance gap between best-in-class assets and commodity office space.
How Significant Is AI’s Role In Office Demand?
AI is the dominant source of net new demand in San Francisco.
- AI companies accounted for 25% of all leasing activity in 2025
- They represent 12% of total occupied office space
- AI firms drove 82% of positive net absorption
- 2.8 million square feet of active tenant requirements are tied to AI companies
This level of concentration is reshaping how office demand is evaluated across innovation-driven markets.
Are Tenants Actively Looking For Space Despite High Vacancy?
Yes—tenant intent is at a record high.
- Tenants are seeking eight million square feet of office space, an all-time high
- Roughly three million square feet represents expected net absorption growth
- Competition is strongest for top-tier buildings, despite over 30 million square feet of vacant space
This reflects a market where quality matters more than quantity.
What Does This Mean For Large Office Tenants In 2026?
Large tenants are entering a strategic window of opportunity.
- Access to best-in-class space at historically favorable economics
- Strong negotiating leverage in most assets, though diminishing at the top end
- Ability to future-proof portfolios before availability tightens in premium buildings
Occupiers with long-term space needs should act before leverage shifts further.
What Does The San Francisco Market Signal For The U.S. Office Sector?
San Francisco is acting as a leading indicator for national office trends.
Key signals for 2026:
- Office recovery will be selective and quality-driven
- High-performance assets will recover first across gateway markets
- Vacancy compression will precede rent growth by several quarters
- Markets with deep talent pools and innovation ecosystems will outperform
What happens in San Francisco today is likely to appear in other top-tier markets next.
Will Office Rents Increase In The Near Term?
Broad-based rent growth is likely to be gradual.
- Effective rent growth will lag occupancy improvements
- Concessions remain elevated due to high availability
- Rent stability and growth will emerge first in trophy and Class A assets
- Meaningful pricing power is more likely in late 2026 and beyond
This is a fundamentals-led recovery, not a pricing-led one.
How Should CRE Executives Respond To This Market Environment?
Executives should focus on portfolio optimization rather than expansion.
Best practices include:
- Prioritizing quality over quantity
- Stress-testing long-term space needs against workforce strategy
- Locking in favorable terms for critical locations
- Evaluating repositioning and consolidation opportunities
The next cycle will reward intentional, data-driven decision-making.
How Does REoptimizer® Help Organizations Navigate This Market?
REoptimizer® provides independent, data-driven advisory services designed to help occupiers:
- Optimize real estate portfolios across multiple markets
- Evaluate lease decisions using real-time market intelligence
- Reduce occupancy costs while improving space performance
- Navigate complex office market cycles with confidence
In markets like San Francisco, where recovery is uneven and timing matters, strategy—not timing alone—drives success.
Rent escalations aren’t inherently “bad.” They’re a normal part of commercial leasing meant to protect a landlord’s revenue over time. The real risk is how the escalation is structured—and how easily the language can shift volatility, compounding, and index-selection power onto the tenant.
This is why escalation clauses are one of the most common “quiet cost drivers” in a lease: the numbers often look acceptable in Year 1, but the clause can create an outsized impact by Year 7, 10, or 15. Let’s talk about how to avoid this.
What Is A Rent Escalation Clause?
A rent escalation clause defines how rent increases over the lease term, including timing (annual, every other year, at specific milestones) and the method used (index-based, fixed, hybrid, or bumps). The nuance most teams miss is that escalations are typically compounding: each increase builds on the last year’s rent, not the original base. That compounding effect is where “small” differences in language become meaningful portfolio-level budget outcomes.
Two subtle points that matter in negotiations:
-
Escalation method interacts with term length. A clause that seems tolerable in a 5-year deal can become a serious exposure in a 12–15 year deal.
-
Escalation language often includes embedded leverage. Index selection, floor/ceiling language, notice timing, and calculation method can all tilt results—without changing the headline escalation “type.”
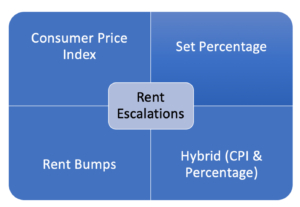
The Four Basic Types Of Rent Escalations
1. CPI Or Inflation-Based Escalations
CPI-based escalations are often presented as “fair”—rent only rises with inflation. But the practical reality is that CPI clauses can be one-sided risk transfer if they don’t include guardrails.
Where CPI gets dangerous (the nuance):
-
Index selection isn’t neutral. Landlords may specify a CPI measure or geography that best supports higher increases. Even small differences in index definition can create materially different outcomes over time.
-
CPI clauses can have “silent” floors. Some CPI clauses include a minimum increase (a floor) even when CPI is low, but still allow full upside when CPI is high. That’s not “inflation protection”—that’s asymmetry.
-
Timing matters more than most people think. CPI is usually measured over a period (e.g., year-over-year). If the clause uses a measurement window that catches an inflation spike, that spike can become embedded in the rent base going forward.
-
Compounding locks in the pain. Even if inflation cools later, the higher rent established during the spike becomes the new baseline for future increases.
How REoptimizer® helps (subtle but powerful):
-
Flags CPI escalation language and the fine print (index, geography, lookback window, floor/ceiling language)
-
Converts the clause into a plain-English summary: “Your rent increases by X, measured by Y, calculated on Z schedule, with limits of A/B”
-
Models multiple inflation scenarios so you can see how “reasonable” becomes “runaway” across the term, especially in longer leases
Negotiation angle that often works:
If CPI is on the table, push for caps and clarity (and avoid floors that create upside-only outcomes). When landlords insist on CPI, the win is often in the guardrails—not in eliminating CPI entirely.

2. Fixed Percentage Escalations
Fixed escalations are typically the most tenant-friendly option because they turn uncertainty into a schedule. But “fixed” doesn’t automatically mean “optimized”—the details still matter.
The nuance in fixed escalations:
-
Fixed is predictable, not always cheap. A fixed 3% may be a win versus CPI during high inflation—but in low-inflation periods it can cost more than what CPI would have done. The key is whether the predictability premium is worth it for your organization.
-
The compounding effect is still real. A fixed increase compounds too, so the difference between 2.5% and 3% is not linear over 10+ years.
-
Fixed escalations can hide in base rent resets. Some leases combine a fixed escalation with periodic “reset to market” language or appraisal mechanisms that function like a second escalation.
-
Fixed increases interact with concessions. A landlord may trade a slightly lower fixed escalation for changes elsewhere (free rent, TI, abatement language, operating expense treatment). The “best deal” is often the one with the best total economics, not the lowest escalation percentage.
Negotiation angle that often works:
Fixed escalations are easiest to justify internally. They also make it easier to create landlord competition because you can compare offers apples-to-apples across properties.
3. Hybrid Escalations (Fixed + CPI Triggers Or Limits)
Hybrid systems are where complexity starts doing real damage—or real good—depending on how they’re structured. A well-built hybrid can be a smart compromise in long-term deals. A poorly built hybrid can quietly recreate CPI risk while looking tenant-friendly.
The nuance in hybrids:
-
Hybrids should reduce volatility, not reintroduce it. The goal is a controlled range of outcomes. If a hybrid clause still allows large CPI swings with minimal limits, it’s not really a hybrid—it’s CPI with extra steps.
-
Trigger design is everything. A “trigger” could be CPI above a threshold, but you need to examine:
-
What measurement period is used?
-
What happens when CPI goes back down?
-
Does the escalation revert, or does it ratchet upward permanently?
-
Caps/floors can create asymmetry. A ceiling (cap) helps tenants. A floor helps landlords. Some hybrids include both—fine—unless the floor is set high and the cap is set too high to matter.
-
Hybrids can be structured as “bands.” For example: 3% unless CPI exceeds X, then 4% for that year only, then revert when CPI normalizes. That approach contains exposure better than “CPI in full if CPI exceeds X.”
Negotiation angle that often works:
Hybrids are a useful concession when landlords won’t commit to fixed increases across long terms. The tenant win is getting the hybrid to behave like a fixed schedule most years while limiting worst-case inflation exposure.
4. Rent Bumps (Set Dollar Increases)
Rent bumps are often viewed as simple, but they can carry their own nuance—especially in how frequently they occur and how they align to market dynamics.
The nuance in rent bumps:
-
Bumps can be more transparent than percentages. Stakeholders can understand “+$0.50/SF” more quickly than compounding percentages—useful for approvals and budgeting.
-
Frequency is negotiable in some markets. Annual bumps are common, but every-other-year bumps can appear when demand is lower or when landlords are trying to stabilize occupancy.
-
Bumps behave differently depending on the starting rent. A $1.00/SF bump is a larger effective percentage when starting rent is low and a smaller effective percentage when starting rent is high. That matters when comparing proposals.
-
Bumps can be paired with renewal options strategically. Tenants can sometimes negotiate different bump schedules for base term vs. renewal periods, aligning increases to business uncertainty.
Negotiation angle that often works:
If you can’t win on the bump amount, win on the timing (less frequent increases) or on other economic levers that reduce total occupancy cost.
Why CPI Escalations Tend To Be The Most Dangerous
CPI escalations feel reasonable because they’re anchored to “inflation,” which sounds objective. But CPI clauses are often where landlords can embed the most optionality and the least predictability for tenants. The biggest tenant-side risk isn’t CPI itself—it’s CPI without boundaries, combined with compounding.
REoptimizer® helps teams avoid the classic mistake: evaluating escalation clauses based on what inflation has been, rather than what it could be over the life of the lease.

How To Negotiate A More Tenant-Friendly Escalation
A strong escalation strategy typically looks like this:
-
Start with a fixed schedule preference (predictability wins internal buy-in)
-
If CPI enters the deal, contain it with clear caps and transparent definitions
-
Avoid one-way clauses (floors without meaningful caps, or ratchets that never revert)
-
Use competition to force landlords to price risk fairly
REoptimizer® supports this by turning lease language into a financial narrative: what you’re paying, when you’re paying it, and what could change under different conditions—so the negotiation isn’t emotional, it’s mathematical.
REoptimizer® Use Cases For Escalation Clauses
-
Clause Risk Flagging: Identify CPI, ratchets, floors, and hybrid triggers early—before late-stage legal review.
-
Scenario Modeling: Test inflation environments so teams can see exposure boundaries, not just the “expected” path.
-
Budget-Ready Rent Schedules: Generate stakeholder-friendly schedules that align to term, options, and renewal structure.
-
Negotiation Prep: Quantify alternatives so you can trade intelligently (e.g., escalation concessions in exchange for TI, free rent, or better renewal terms).

Schedule a demo today to see hoe REoptimizer® can level up your portfolio by strengthening each individual lease.
Book a Demo
FAQ’s Rent Escalation:
Which rent escalation is safest for tenants?
Most tenants prefer 2. Fixed Percentage Escalations because predictability reduces budget risk and approval friction.
Why can CPI escalations become expensive even if inflation falls later?
Because rent is usually compounding. A high CPI year can increase the base rent permanently, and subsequent increases build on that higher number.
Are hybrid escalations good or bad?
3Hybrids can be good when they genuinely limit volatility (caps, bands, reversion). They’re risky when they add complexity without adding real limits.
Are rent bumps better than fixed percentages?
Rent Bumps can be excellent for transparency and, in some cases, negotiable frequency. The “better” option depends on starting rent, bump size, and term length.
Commercial lease renewals are no longer a routine administrative task. In today’s office market, they are one of the most powerful—and underutilized—levers for reducing occupancy costs, improving space utilization, and reshaping a company’s real estate portfolio.
Done strategically, a renewal can unlock millions in savings, flexibility, and optionality. Done passively, it can quietly lock in outdated economics, underused space, and unnecessary risk for years.
This guide explains how to approach commercial lease renewals—and how modern portfolio intelligence tools like REoptimizer® allow tenants to make renewal decisions with clarity, leverage, and confidence.
What Is A Commercial Lease Renewal?
A commercial lease renewal is the process of extending, renegotiating, or restructuring an existing office lease before its expiration. While many leases include renewal options, exercising them without market analysis can be one of the most expensive mistakes tenants make.
A renewal should be treated as a new transaction, evaluated against current market conditions, space utilization, and long-term business strategy—not as a default continuation of the past.
Why Commercial Lease Renewals Matter Right Now
The office market didn’t just “bounce” into a new cycle—it repriced risk and value. That shows up in how landlords underwrite deals, how employees experience offices, and how finance teams judge real estate decisions.
-
Hybrid Work Changed Utilization, Not Just Attendance
It’s not simply “fewer days in-office.” It’s spikier demand (peaks midweek, valleys Monday/Friday), more cross-functional collaboration days, and greater sensitivity to layout quality. Two companies can have the same headcount and radically different space needs depending on scheduling norms, team structure, and meeting behavior.
-
Vacancy Is Elevated, But Leverage Is Uneven
Many submarkets have plenty of availability, yet best-in-class buildings can still command stronger pricing and terms because they’re winning the “flight to quality.” That means renewals aren’t about “rent down” everywhere—they’re about choosing whether you’re paying for quality, flexibility, or pure cost, and negotiating accordingly.
-
The Real Gap Is Between “Contracted Rent” And “Market Reality”
A lot of tenants are sitting in leases negotiated under very different assumptions—growth projections, in-office expectations, and rent trajectories. Even when face rent looks acceptable, the total economics can drift: escalations compound, operating expenses rise, and older leases often lack modern flexibility (givebacks, expansion rights, sublease freedom, termination options).
-
Capital Markets And Building Health Now Matter To Tenants
Lease decisions used to be mostly about space and price. Now, tenants also have to think about landlord capacity to fund improvements, maintain services, and execute capital work. Building-level financial stress can translate into operational friction—or become leverage if you understand the owner’s incentives and timing.
-
Costs To Move Or Build Out Are Higher And More Variable
The renewal vs. relocate math isn’t just about rent. It’s about TI dollars, construction timelines, permitting risk, downtime, furniture/IT, and change management. In many cases, the “cheapest rent” option loses once you model the full cost and risk to execute.
-
Leadership Teams Want Finance-Grade Decisions
CFOs and executives increasingly expect real estate choices to be justified like any other investment: NPV impact, scenario planning, risk tradeoffs, and measurable utilization—not anecdotes like “people like the building.” That’s why the renewal window is so valuable: it’s one of the few times you can make a high-impact change with a clear decision point and negotiation leverage.
Net: the renewal window is one of the only moments where tenants can reset economics, right-size intelligently (not blindly), and rebalance portfolios—but only if they have visibility into things like remaining lease NPV, true utilization by site, comparable deal terms, and relocation scenarios (exactly the inputs tools like REoptimizer® are built to centralize).

The Four Most Common Commercial Lease Renewal Mistakes
1. Treating A Renewal Like A Paperwork Exercise
Tenants often assume that staying put is the safest option. Familiarity with the space, landlord, and commute patterns can create a false sense of security.
But renewing without analysis often means:
-
Overpaying above market rent
-
Carrying excess or poorly configured space
-
Locking into outdated lease terms and escalations
A renewal is a multi-year financial commitment and should receive the same scrutiny as a new lease—sometimes more.
2. Negotiating Without Understanding True Portfolio Economics
Many tenants negotiate renewals in isolation, looking only at:
-
Current rent
-
Renewal option language
-
Short-term savings
What’s often missing is visibility into how each lease performs inside the broader portfolio.This is where modern portfolio analytics change the game.With REoptimizer®, tenants can:
-
See the remaining Net Present Value (NPV) of each lease
-
Understand how future rent escalations compound over time
-
Compare the cost of staying versus relocating or restructuring
-
Identify which locations are financial outliers
Without this data, tenants negotiate blind.
3. Ignoring Utilization And Right-Sizing Opportunities
Excess space is one of the largest hidden costs in corporate real estate.
Many organizations no longer need the same footprint they signed for years ago—but that doesn’t always mean a simple reduction. The real opportunity lies in nuanced optimization. REoptimizer® enables tenants to:
-
Measure utilization at each site
-
Identify underused locations and redundant footprints
-
Evaluate whether satellite offices can be consolidated
-
Model scenarios like combining locations into a single, higher-quality hub
Instead of asking, “How much space do we cut?” The better question is, “How should our space actually work?”
4. Failing To Leverage The Market With Real Alternatives
Landlords negotiate differently when they know a tenant has credible options.
However, “alternatives” only create leverage if they are:
-
Comparable in quality and function
-
Priced accurately on a net-effective basis
-
Evaluated alongside renewal economics
REoptimizer® allows tenants to:
-
Match renewal terms against true market comparables
-
Compare new locations side-by-side with the existing lease
-
Model total occupancy costs across multiple scenarios
-
Create defensible competition for their tenancy
This transforms negotiations from reactive to strategic.

How REoptimizer® Changes The Commercial Lease Renewal Process
Traditional renewal planning relies on spreadsheets, fragmented data, and anecdotal market knowledge. REoptimizer® replaces that with a centralized decision platform.
Portfolio-Level Intelligence
Utilization And Strategy Alignment
-
Site-level utilization insights
-
Identification of consolidation and combination opportunities
-
Alignment with hybrid work policies and growth plans
Market And Scenario Comparison
-
Comparable lease benchmarking
-
Renewal vs. relocation modeling
-
Side-by-side evaluation of multiple options
Faster, Better Decisions
-
Clear visuals for executives and finance teams
-
Scenario modeling that supports internal buy-in
-
Data-backed negotiation strategies
The result: better outcomes with less guesswork.
When Should You Start Planning A Commercial Lease Renewal?
For most office tenants, renewal planning should begin 18–36 months before lease expiration, depending on portfolio size and complexity.
Starting early allows tenants to:
-
Identify leverage well before deadlines
-
Avoid costly extensions or rushed decisions
-
Use time as a negotiating advantage
-
Align real estate decisions with broader business planning
With tools like REoptimizer®, early planning becomes practical—not overwhelming.
The Bottom Line: Renewals Are Where Portfolios Are Won Or Lost
Commercial lease renewals are no longer about simply staying or leaving. They are about optimizing an entire portfolio—financially, operationally, and strategically.
Tenants who succeed will:
-
Treat renewals as new investments
-
Use data, not assumptions
-
Understand utilization at a granular level
-
Leverage market alternatives intelligently
-
Equip themselves with the right technology and representation
REoptimizer® doesn’t replace strategy—it enables it.Want to see how it can level up your portfolio? Book a demo today.
Book a Demo
Commercial Lease Renewal FAQs
When Should I Start Planning A Commercial Lease Renewal?
Most tenants should begin planning 18–36 months before lease expiration. Starting early gives you time to benchmark the market, build internal alignment, and create real negotiating leverage—without risking costly extensions or rushed decisions.
Should I Exercise My Renewal Option Or Renegotiate?
A renewal option is not automatically the “best deal.” Many option clauses reset only some terms (or lock in above-market economics). The safest approach is to price the option against market comparables and alternative locations, then choose the path with the best net-effective outcome.
How Do I Know If I’m Overpaying Rent?
You’re likely overpaying if your lease was signed in a stronger market and has compounding escalations, or if comparable buildings are offering better economics (rent, concessions, flexibility). The most reliable test is a true side-by-side comparison of:
-
Base rent + escalations
-
Operating expenses (and caps)
-
Tenant improvement allowance
-
Free rent / abatement
-
Move, build-out, and downtime costs
What Are The Biggest Negotiation Levers In A Lease Renewal?
Most renewal wins come from negotiating the full value stack, not just rent:
-
Tenant improvement (TI) dollars
-
Free rent / rent abatement
-
Operating expense protections (caps, exclusions, audit rights)
-
Flexibility clauses (expansion, contraction, termination options)
-
Parking, signage, and amenities
-
Sublease and assignment rights
Can I Reduce My Square Footage During A Renewal?
Often, yes—but it depends on building layout, the landlord’s leasing strategy, and timing. Many tenants pursue:
-
A direct reduction (smaller suite)
-
A re-stack within the building
-
A blend-and-extend with resizing
-
A partial giveback paired with a longer term
The key is to make the new footprint worth it to the landlord (term, credit, stability, or avoided vacancy risk).
How Do I Measure Office Utilization Before A Renewal?
Utilization should reflect how people actually use the space—by day, department, and peak periods—rather than assumptions. Measuring utilization helps you avoid renewing excess space and can reveal opportunities like consolidating teams, redesigning layouts, or combining nearby satellite locations.
What Is Remaining Lease NPV And Why Does It Matter?
Remaining lease NPV (Net Present Value) estimates the value of your remaining lease obligations in today’s dollars. It helps decision-makers compare options like:
-
Renewing vs. relocating
-
Downsizing vs. reconfiguring
-
Shorter term vs. longer term
-
Paying more now vs. avoiding higher long-term cost
NPV makes “stay vs. go” a finance-grade comparison instead of a gut call.
How Can REoptimizer® Help With Lease Renewals?
REoptimizer® helps tenants turn renewals into a portfolio optimization decision by enabling you to:
-
See the remaining NPV of each lease
-
Understand escalation exposure and term risk
-
View utilization by site to identify right-sizing opportunities
-
Spot nuanced consolidation plays (like combining satellite locations)
-
Match market comparables and benchmark deal terms
-
Compare renewal vs. new location scenarios side-by-side
How Do I Create Leverage In A Renewal Negotiation?
Leverage comes from credible alternatives and a clear plan. The best path is to:
-
Identify 2–4 realistic relocation options
-
Compare them against the renewal on a net-effective basis
-
Communicate that you can execute (not just “shop around”)
-
Keep options alive until the renewal is fully documented
Do I Need A Tenant Representative For A Renewal?
It’s not required, but it’s often the difference between an average deal and an optimized one. A tenant rep brings:
-
Market benchmarks and comp visibility
-
Negotiation strategy and leverage building
-
Term and legal-risk awareness
-
Time savings and process control
What If I Wait Too Long To Start The Renewal Process?
If you wait, you risk:
-
Losing renewal rights or negotiation windows
-
Paying for expensive short-term extensions
-
Accepting unfavorable terms due to time pressure
-
Missing better market opportunities
Time is leverage—starting early protects it.
