As we look at the data from early 2026, a clear paradox has emerged: Office utilization is surging, yet global occupancy is technically over capacity.
In plain English, this means that while people are finally using the office again, companies have shrunk their real estate so much that the math no longer adds up on a Tuesday morning.
The office isn’t empty anymore, but it’s also not “back to normal.” It’s being hyper-optimized. Companies are trying to fit more employees into less office space to save costs, but they are hitting a new roadblock: a “capacity wall” that is starting to hurt employee satisfaction.
So let’s explore the data-driven reality of the return to office mandate, the impact on employee satisfaction, and how senior leaders are utilizing advanced transaction management software to navigate the “density squeeze.”

The Returning to Office Paradox
According to the latest 2026 reports, office building utilization reached 53% in 2025—a massive leap from the 35% seen just two years prior.
On the surface, this suggests that the return to the office is working. However, the underlying data reveals a significant friction point for many organizations.
Peak Days, Employee Satisfaction, and the Capacity Wall
For senior leaders, this presents a dual-headed monster: How do you enforce an office return when the office is physically too small for a full return?
Remember over half of the world’s largest organizations right-sized their footprints in a post-covid working environment. We’re dealing with the next leg of a pandemic readjustment.
1. The 111% Rule: The “Oversold Flight” Strategy
Think of this like an airline that sells 111 tickets for a plane with only 100 seats. They do this because, historically, someone always misses their flight.
- The Strategy: Many organizations have realized that with a hybrid work policy, having a 1:1 desk-to-employee ratio is a waste of capital. By allocating 111% of their workforce to a physical location, they are betting that on any given day, at least 11% of people will be working remotely, on vacation, or out at meetings.
- The Reality: This works perfectly on a Monday or Friday. But the moment a return to office mandate forces a “All Hands” meeting on a Wednesday, the “flight” is overbooked.
- The Consequence: This is where “Coffee Badging” (showing up just to be seen) turns into “Floor Wandering.” If employees can’t find a place to sit within ten minutes, job satisfaction plummets and they head back to their own home.
2. The Squeeze: Efficiency vs. The “Human Radius”
In the “old days,” we had a “buffer zone” of personal space. That buffer is officially gone.
- The Strategy: By tightening design density to 190 square feet per seat, employers are maximizing the yield of their workplace. It looks great on a spreadsheet because it lowers the “cost per head.”
- The Reality: Humans aren’t just data points. When you pack people this tightly, you hit capacity pressure. This isn’t just about elbow room; it’s about acoustics.
- The Consequence: Without the luxury of “dead space” to absorb sound, the office becomes a cacophony of Zoom calls and chatter. Heads down work and quiet time become impossible. The very collaboration that senior leaders want actually suffers because the environment is too overstimulating for deep thought.
3. The Tuesday-Thursday Peak: The “Mid-Week Bottleneck”
If utilization were spread evenly across five days, a 53% average would be a dream for organizations. But work culture doesn’t move in a straight line; it moves in a bell curve.
- The Strategy: Most hybrid work models allow for flexible work, which inevitably leads to many workers choosing the same specific days (Tuesday, Wednesday, and Thursday) to be in office.
- The Reality: While the weekly average is manageable, the peak utilization hits 80%. This is significantly higher than the 65% target—the “Goldilocks Zone” where a building feels vibrant but not crowded.
- The Consequence: At 80% utilization, every “extra” amenity breaks. The elevators take longer, the gym is packed, and the “hot desking” app shows zero availability by 9:15 AM.

The Remote Work Generational Divide
The remote and hybrid work debate is no longer a monolith. By 2026, the data shows that job satisfaction is tied directly to how leaders manage the flexible work spectrum.
Hybrid Work Priorities by Generation
| Demographic | Preference | Key Factor |
| Gen Z | In-Person Work | Mentorship and collaboration. |
| Millennials | Hybrid Approach | Better work-life balance and childcare. |
| Baby Boomers | Office Work | Traditional management practices and structure. |
Recent surveys indicate that most employees (84%) feel more productive in a hybrid work setting. However, rto mandates are often seen as “passive layoffs.” In fact, 25% of executives recently admitted they hoped a return to office mandate would trigger voluntary departures.
“The mandates aren’t filling offices; they’re just losing talent. High-performing employees are 16% more likely to leave when facing a rigid mandate.” — 2026 Workplace Research
The Industrial Pivot: Warehouse vs. Office
For tenants with mixed portfolios, the federal workforce trends and private sector office mandates are only half the story. The “Infill Industrial” movement of 2026 has made warehouse space as scrutinized as the office.
- The Micro-Fulfillment Shift: Many organizations are now subdividing massive, 500,000-square-foot “big box” sites into smaller, multi-tenant nodes. Why? To accommodate last-mile delivery needs that require being closer to the consumer’s own home.
- Power and Automation: By 2026, the key factors for warehouse selection have shifted from mere square footage to power availability. As e-commerce giants and major companies integrate AI-driven robotics, a facility’s ability to support high-density automation is the new gold standard for performance.
- The Flexible Lease: Following the hybrid work trend, industrial tenants are increasingly offering flexibility in their own portfolios—moving away from 10-year commitments toward “elastic” short-term arrangements that allow them to scale as workers and demand fluctuate.
The Hub-and-Spoke Reality: Beyond the Central HQ
The traditional “Central HQ” is being replaced by a more agile hub-and-spoke model. Many workers and managers have realized that a long commute to a downtown office is the primary killer of employee satisfaction.
- Regional Strength: We have seen a 20% rise in interest for suburban and regional hubs that combine office work and logistics in a single “flex” location.
- The Commute Factor: By placing “Spoke” offices near regional warehouse clusters, employers are successfully bridging the gap between in-person work and better work-life balance.
- Data-Driven Placement: Leaders are now using research and recent surveys to place these hubs in “talent-rich” suburbs where Gen Z and Baby Boomers actually live, effectively reducing “commute friction” while maintaining collaboration.
The 2026 Insight: For the modern business, the goal is no longer a full office return to a single point on a map. It’s about building a workplace network that is as fast and flexible as the supply chain itself.

Critical Factors for Portfolio Optimization
To manage this complexity, employers are focusing on portfolio optimization as a top priority. The primary driver is a plan for contraction—expecting to need less space due to working remotely part of the week.
Data-Driven Decision Making for Remote and Hybrid Work
- Desk Sharing Ratios: 69% of organizations now utilize desk sharing. The sweet spot for performance is currently 1.01–1.49 people per seat.
- Specific Days: Successful managers are letting teams decide their own in office days (e.g., three days a week) rather than a top-down week starting Monday mandate.
- Noise & Technology: Investment in noise reduction and collaboration tech is crucial to keep employees from fleeing back to their own home for “real work.”
Optimization Through Transaction Intelligence
In the high-stakes environment of 2026, “gut feeling” real estate decisions aren’t just risky—they are a liability to the bottom line. Organizational health now depends on key insights that bridge the gap between remote work benefits and the logistical necessity of in-person work.
REoptimizer® is the definitive transaction management software for corporate tenants navigating the “111% occupancy puzzle.” Whether you are orchestrating a full office return for a massive federal workforce or fine-tuning a hybrid work policy for a global company, our platform transforms raw data into a competitive advantage.
Why REoptimizer® is Critical for the 2026 Portfolio:
- Precision Deal Optimization: Stop overpaying for underutilized square footage. Ensure every lease—from high-rise office towers to last-mile warehouse hubs—is data-driven and aligned with actual workforce attendance.
- True Portfolio Transparency: Gain a real-time view of where your workers are actually productive and where your space is being wasted. Identify the “density squeeze” before it impacts employee satisfaction.
- Agile Transaction Management: Streamline the complex practice of disposing of redundant assets, subletting mid-week “ghost zones,” or rapidly acquiring regional hubs to accommodate flexible work growth.
- Performance Benchmarking: Use research-backed metrics to compare your workplace efficiency against industry standards, ensuring your senior leaders are making moves that support long-term productivity.
Don’t Manage the Future with Yesterday’s Spreadsheets
The future of business belongs to organizations that treat their real estate as a dynamic asset, not a fixed cost. REoptimizer® gives leaders the tools to explore new opportunities, optimize specific days, and ensure that every person in the team has the right space at the right time. See the difference it can make in your portfolio today.
Book a Demo
CRE transaction management software is a platform that helps you run commercial real estate deals end-to-end—from requirements and site selection through negotiations, approvals, documentation, and close—so every deadline, cost, and decision is tracked in one place (instead of living in spreadsheets, inboxes, and scattered folders).
REoptimizer® is built for exactly this: centralizing portfolio data and automating reporting, alerts, and workflows so teams can move faster and negotiate from a stronger position.

Who Can Benefit from CRE Transaction Management Software?
If your organization has more than a few locations—or multiple deals happening at once—transaction management software becomes a necessity, not a “nice to have.”
Typical users include:
- Corporate Real Estate (CRE) And Portfolio Strategy teams managing growth, consolidation, relocations, and renewals
- Finance / FP&A tracking budgets, approvals, and forecast vs. actual
- Legal managing LOIs, redlines, and compliance documentation
- Operations / Workplace / Facilities aligning space with headcount and utilization
- Executives who need a clear view of deal risk, savings, and timing
REoptimizer® is positioned for enterprise teams dealing with complexity—replacing “spreadsheets, siloed systems, and manual processes” with a single system of record.
What CRE Transaction Management Software Does
At its core, CRE transaction management software helps you:
- standardize the process (repeatable workflows and checklists)
- coordinate people and deadlines (ownership, reminders, accountability)
- organize documents (versions, approvals, audit trail)
- track costs line-by-line (so overages don’t hide in the noise)
- report in real time (so leadership isn’t waiting on a “Friday spreadsheet”)
REoptimizer® adds a key layer: it’s designed to help teams compare deal economics against comps and benchmarks and generate reporting fast with templates—because the real money is won or lost in the details.

Where It Fits (And Why It’s Not The Same As Lease Management)
A simple way to think about the lifecycle:
Before The Deal: Strategy And Site Search
This is where teams define what they need and evaluate options. REoptimizer® supports this with KSDs (Key Site Drivers) and tools like CRESiteIQ™, built to analyze markets, compare sites, and visualize opportunities. More on in the next section…
During The Deal: The Transaction Itself
This is the heavy-lift phase: comps, negotiations, approvals, legal, due diligence, and getting to signature/close.
After The Deal: Lease Management
Lease management is what happens after execution—tracking key dates like renewals, expirations, options, and escalations. REoptimizer® content points out how missed key dates can create real cost and risk at portfolio scale.
Bottom line: lease management is “operate what you signed.” Transaction management is “control what you sign.”
What Are KSDs?
KSDs (Key Site Drivers) are the criteria that define what “best location” means for your business—then you weight and score them so every option can be compared objectively (not emotionally, not anecdotally, and not based on whoever toured last). Consider them your highly unique KPI’s.
REoptimizer® uses KSDs to score each property in real time and calculate a final weighted score per building, instantly ranking your top contenders side-by-side.
Why KSDs Are Invaluable (And Why Teams That Use Them Win More Often)
They Turn “Opinions” Into A Repeatable Decision System. Without KSDs, site selection usually sounds like:
- “This one feels right.”
- “The price is good, but…”
- “Leadership likes that submarket.”
KSDs force alignment upfront. You define the “must-haves” and “deal-breakers” before you tour, so your team is evaluating every property against the same standard.
They Help You Compare The Stuff That’s Hard To Measure
Price and square footage are easy. The real risk is everything else:
- Workforce access and commute patterns
- Truck access and delivery windows
- Power capacity and future expansion needs
- Column spacing, dock ratios, clear height (industrial)
- Customer proximity and logistics cost impacts
- Rent vs market comps (and trend direction)
- Total Occupancy Cost (rent + CAM/NNN + taxes + insurance + utilities)
- Current utilization vs required utilization (desk sharing, peak days)
- Adjacency needs (teams that must be near each other
- Layout efficiency (loss factor, usable vs rentable SF)
REoptimizer’s® KSD approach is designed specifically to capture those “hard-to-quantify” drivers and make them scorable—so the best site isn’t just the cheapest, it’s the lowest total cost of occupancy and best operational fit.

They Save Time By Eliminating Bad-Fit Tours Early
One of the most expensive mistakes companies make is touring before they’ve defined what matters most. REoptimizer calls this out directly: teams waste time touring warehouses without clear KSDs—then end up revisiting assumptions mid-process. When KSDs are set first, you filter faster and only tour buildings that can realistically win.
They Strengthen Negotiations Because You Know Your Leverage
When you can prove (with scoring) that multiple buildings meet your needs, negotiations change:
- You’re selecting from the strongest options and negotiating from leverage.
- You can back up concession requests with evidence, using comps plus the operational requirements that drive real value.
- You reduce waste by not paying extra for features that don’t move the needle for your business.
Because Reoptimizer® scores contenders side-by-side and ranks them instantly, your team walks into negotiation with clarity: what matters, what doesn’t, and what you can walk away from.
They Keep The Portfolio Aligned With The Business (Not Just The Deal)
The biggest value of KSDs isn’t picking a building—it’s ensuring every location decision supports the business:
- growth plans
- service levels
- labor strategy
- cost targets
- utilization and waste reduction
REoptimizer’s® broader positioning is exactly this: giving teams visibility into overspending and underused space, then translating that into action through dashboards and metrics—so site decisions don’t live in a one-time spreadsheet, they become an operational advantage.
How REoptimizer® Makes KSDs Practical (Not Just A Worksheet)
Here’s the difference between “having KSDs” and using KSDs:
- Score Each Property In Real Time: As you evaluate a site, REoptimizer scores how well it delivers on each KSD—immediately, even while touring.
- Rank Overall Suitability: REoptimizer calculates a weighted score per building and instantly highlights top contenders.
- Expand Site Intelligence With CRESiteIQ™: For location strategy, CRESiteIQ™ helps define what matters and compare sites using many data points (example categories include demographics, income, fuel costs, population trends, and more).

Why Your Portfolio Needs CRE Transaction Management Software
In CRE, savings (or losses) don’t come from “being organized.” They come from making better decisions earlier and catching issues before they get locked into the deal.
Transaction management software helps you:
- Avoid missed deadlines that weaken leverage
- Prevent “death by a thousand line items” (fees, escalations, TI, concessions, operating assumptions)
- Benchmark against comps instead of negotiating blind
- Expose underutilization and waste so the portfolio improves over time
REoptimizer® specifically highlights eliminating wasted effort by centralizing data and automating alerts/workflows—so teams spend time on strategy, not chasing updates.
Why Spreadsheets Don’t Work For Transaction Management
Spreadsheets are fine for a single deal. They fail when you’re handling:
- Multiple stakeholders and approvals
- Changing versions of assumptions and documents
- Market comps, benchmarks, and reporting needs
- Utilization/waste measurement across a portfolio
That’s why REoptimizer® focuses on replacing spreadsheets and siloed tools with a centralized platform and automation.

FAQs
What Is CRE Transaction Management Software?
It’s software that manages the full commercial real estate deal process—tasks, deadlines, documents, approvals, and costs—from strategy through close, so nothing falls through the cracks.
How Is CRE Transaction Management Different From Lease Management?
Lease management is post-signature administration (key dates, escalations, compliance). Transaction management covers the whole process where the economics and terms are created.
Who Needs CRE Transaction Management Software?
Any company with a multi-location portfolio or frequent transactions—especially when deals involve finance, legal, operations, and leadership approvals.
How Does REoptimizer® Help With CRE Transaction Management?
REoptimizer® helps enterprise teams centralize portfolio data and automate reporting, alerts, and workflows—and supports site selection and deal evaluation with KSD scoring and related tools.
What Is CRESiteIQ™?
CRESiteIQ™ is a REoptimizer® tool for site selection, built to analyze markets, compare sites, and visualize opportunities in one platform.
What Are Key Site Drivers (KSDs) In Commercial Real Estate?
KSDs are your business’s weighted location criteria—used to score and compare properties objectively so you can identify the best-fit sites faster.
Why Should KSDs Be Weighted?
Because not all criteria matter equally. Weighting prevents teams from over-prioritizing “nice-to-haves” (or the loudest opinion) over the drivers that actually impact cost, operations, and performance.
How Does REoptimizer Use KSDs?
REoptimizer® scores each property against your KSDs in real time and produces a final weighted score to rank contenders side-by-side.
Learn more about REoptimizer® today.
Need any more proof that the AI revolution is already here? On Tuesday, Amazon confirmed 14,000 layoffs, adding to a growing list of major companies cutting their workforces in the name of efficiency gains. The move comes as Amazon CEO Andy Jassy continues his campaign to streamline the company’s sprawling operations while doubling down on what he calls “the most transformative technology of our generation”: artificial intelligence.
According to Fortune, “The new cuts come as Amazon continues to look for ways to lower employee costs while investing aggressively in AI products and infrastructure—both for internal use and to sell to enterprise customers. The company has said it intends to devote upwards of $100 billion in capital expenditures this year, as it builds out its cloud and AI data centers.”
Amazon’s balancing act is now emblematic of a new reality: fewer people, more machines, and a rapidly changing corporate footprint that could alter how—and where—companies operate.

Amazon CEO Andy Jassy and Big-Tech Cuts
Jassy has overseen the largest layoffs in Amazon’s history, cutting at least 27,000 corporate jobs between late 2022 and 2023. Those reductions represented a high-single-digit percentage of the company’s total corporate workforce, which was already among the world’s largest white-collar populations.
Now, another 14,000 Amazon employees are out of work as part of this new phase. At the same time, the company says it expects to “continue hiring” in key strategic areas such as cloud infrastructure, generative AI, and logistics technology even as it “shifts resources” away from repetitive, back-office functions.
This mirrors what’s happening across the economy. UPS announced cuts of more than 34,000 operational roles earlier this year, with another 14,000 management positions eliminated. Target plans to slash 1,800 corporate jobs, while Paramount Skydance is cutting 1,000 roles now and another 1,000 later, according to the Los Angeles Times.

Even Meta, one of the perceived winners in the AI-fueled economy, is trimming headcount in some departments to focus on “biggest bets” like the metaverse and AI infrastructure.
AI’s Promise—and Its Human Cost
The rationale? Artificial intelligence is enabling companies to automate faster and operate with fewer layers of management. “Those who embrace this change, become conversant in AI, help us build and improve our AI capabilities internally and deliver for customers, will be well-positioned to have high impact,” Jassy wrote to staff. “We expect that this will reduce our total corporate workforce as we get efficiency gains from using AI extensively across the company.”
In other words, AI isn’t replacing everyone’s jobs… but those utilizing AI will take the jobs of those who aren’t.
Beth Galetti, Amazon’s Senior Vice President of People Experience and Technology, has also been blunt. The company is “finding additional places” where automation and generative AI can streamline operations, particularly in human resources and communications—divisions now under heavy restructuring.

Human Resources is “Pulled in for a Chat”
According to Fortune, Amazon is preparing to cut as much as 15% of its HR staff, with more layoffs likely in other divisions.
For many workers, the “world’s largest startup,” as Amazon likes to call itself, is behaving less like a growth rocket and more like a case study in reducing bureaucracy to “increase ownership.” The irony: in the race to simplify, thousands of roles designed to enable human work are being replaced by algorithms that remove it.
Generative AI: Efficiency Gains or Workforce Disruptor?
Generative AI is the catalyst here. It’s not only rewriting the rules of content and customer service—it’s reshaping how corporations allocate resources. Goldman Sachs recently surveyed more than 100 of its bankers and found that only 11% of U.S. companies are actively reducing headcount due to AI today, but a “more sizable reduction could come later.”
That “later” is coming fast. As AI matures, jobs that are repetitive, data-heavy, or standardized are the first in line for automation. In Amazon’s case, HR is only the beginning. Roles in internal communications, compliance, and even mid-tier management are being reevaluated. The fewer layers mantra is spreading across departments that once anchored corporate office space.

For commercial real estate, this shift is seismic. The office footprint designed for training programs, onboarding, and collaborative “people experience” functions may simply not be needed at prior scale. With AI shouldering tasks once done by junior analysts, HR coordinators, or administrative teams, companies are reevaluating not just headcount but square footage.
CRE Implications: When AI Shrinks the Office
The implications for landlords and occupiers are immediate. A company that trims thousands of back-office jobs will inevitably shift demand for space. Large office campuses—especially those configured for dense, repetitive workflows—will feel the effects first.
At the same time, the warehouse and logistics side of the CRE equation is moving in the opposite direction. As AI improves forecasting, fulfillment, and e-commerce logistics, demand for industrial and data-center assets is growing. Amazon’s plan to spend over $100 billion this year on AI and cloud infrastructure points to a physical shift in where value is created: less cubicle space, more server racks.
Retail faces a similar transition. As Amazon CEO Andy Jassy noted recently, AI will accelerate the end of brick-and-mortar’s reign. E-commerce—which already drives the majority of Amazon’s growth—is set to expand further as AI extensively personalizes recommendations and streamlines logistics. That could mean continued pressure on traditional shopping centers and renewed competition for last-mile distribution sites.

In short: fewer offices, smaller stores, bigger data centers.
The Company That’s Re-Coding Itself
Amazon’s internal transformation reflects the broader trend of shifting resources to key strategic areas while pruning what doesn’t scale. The company’s senior leadership—especially Beth Galetti and Jassy—frame this as the natural evolution of a business that must constantly “figure out how to deliver for customers” in a world “changing quickly.”
But the pace and scope of the job cuts suggest something deeper: a structural rewrite of how tech giants operate. Instead of layering more middle management, companies are removing layers and promoting more ownership among remaining staff. The goal is to increase efficiency, not just in code, but in the corporate workforce itself.
It’s also a hedge against the next downturn. By investing in transformative technology now, Amazon is betting that automation will permanently lower costs—even if it means temporary reputational damage from high-profile layoffs and severance pay headlines.
Not All Doom—But a Redefined Future of Work
Despite the headlines, AI isn’t coming for everyone’s job. Workers who learn to use AI tools, build systems, and operate within automated processes will be the ones who stay—and advance. In Amazon’s internal logic, these employees “own more” precisely because they can do more with less.
In practical terms, this will lead to a smaller but more specialized corporate workforce, concentrated in technical, strategic, and creative roles that AI can’t yet replicate.

That means CRE demand could shift toward flexible office space configured for high-impact collaboration and away from traditional seat-based planning.
A New Corporate Geography
From a real-estate standpoint, this AI-driven reshuffle is as much about where work happens as how. Amazon’s recent facility investments reflect a pivot from traditional corporate offices toward logistics, robotics, and data infrastructure. Expect other companies to follow: trimming central office space while expanding AI development hubs, cloud campuses, and training facilities for technical staff.
For cities still struggling with post-pandemic vacancy, that’s a mixed outlook. While demand from tech and data-center operators may buoy some markets, downtown towers built for massive white-collar headcounts could face continued softness.
The Efficiency Era Begins
The Amazon layoffs aren’t just another round of cost-cutting—they’re a signal that the efficiency era of corporate America has begun in earnest. AI is no longer an experiment; it’s a re-architecting force that’s already affecting offices, jobs, and business models.
The companies that thrive will be those that treat AI as infrastructure, not novelty—reallocating resources wisely, trimming bureaucracy, and aligning real estate to an agile, data-driven workforce.
For CRE professionals, the question isn’t whether AI will change tenant demand—it’s how fast.
As Jassy put it, the companies that embrace change and operate across the company with AI extensively will “help reinvent the company.” That reinvention won’t just happen on servers. It’ll happen in square footage, site plans, and balance sheets across the commercial real estate world.
How the 2025 Economic Divide Is Reshaping Real Estate Strategy
National economic headlines suggest the U.S. economy is chugging along fine: 3.8% GDP growth and 4.3% unemployment would normally point to stability.
But as Moody’s latest state-by-state analysis shows, the story beneath the surface is deeply uneven.
Only 15 states, including California, Texas, and New York, are expanding. 22 states have slipped into recession, and another 13 are “treading water.”In short, nearly three-quarters of the country is either shrinking or stagnating economically.
For commercial real estate (CRE) professionals, that split has direct implications: leasing demand, tenant stability, and capital flow are now highly regionalized—and asset performance is diverging sharply.
The New Geography of Growth
The economic imbalance isn’t evenly distributed.States like California, Texas, and New York (each ranking among the top 11 economies in the world) are propping up the national average. Their scale masks weaker conditions across much of the country.

By contrast, much of the country is struggling with slower industrial output, declining migration, and tighter fiscal conditions. Louisiana, Tennessee, Kansas, and Missouri have all tipped into recession territory, as manufacturing and construction activity retreat and labor markets soften. States like Georgia and Arizona are treading water—held back by cooling housing markets and tepid consumer spending that neutralize gains in logistics and manufacturing. The result is a bifurcated economy: a handful of coastal and high-growth states are keeping the national figures afloat, while large portions of the Midwest and South are already in a localized downturn.
That means the traditional CRE logic of “following national indicators” no longer works.
Today’s tenants and investors need granular, state-level intelligence to make portfolio decisions.
For tenants, it’s about stability:
- In growing states, expect continued rent growth and competitive renewals.
- In contracting states, landlords may offer more flexible terms or incentives to retain occupancy.
For investors and landlords, it’s about concentration risk:
- Portfolios overweighted in slow-growth or agricultural-heavy states could face rising vacancy and downward pressure on valuations.
- Diversifying into logistics or tech-adjacent markets like Texas, Florida, North Carolina, and Colorado can balance exposure.
Debt and the Consumer Connection
Household debt has reemerged as a key drag on regional performance.
Americans now hold over $1 trillion in credit card debt, $496 billion in auto loans, and $1.8 trillion in student loans—near record highs.
In states already in recession—Arkansas, Oklahoma, and West Virginia—that debt burden is suppressing local consumer spending, reducing demand for retail, small-business space, and service-oriented office users.
Meanwhile, higher-income households in expanding states continue to spend, supporting urban retail and mixed-use redevelopment. This growing divide means real estate fundamentals are now tied more closely to household balance sheets than macro GDP figures.

The Wage Gap That Shapes Leasing Demand
Federal Reserve data highlights the same pattern: wage growth is +14% for top quartile earners but –1% for bottom quartile earners. Put differently: the lowest-paid workers are barely keeping pace with inflation, while high-wage earners continue to make real income gains.
That imbalance affects tenant mix and space utilization across asset types:
Industrial & logistics: Regions anchored by high-paying industries—advanced manufacturing, information tech, life sciences—are sustaining footprint expansion even in a soft economy, as firms backfill operations or relocate to lower-cost sites with skilled labor pools.
Retail (especially neighborhood / small-format)
Weak wage growth at the lower end constrains discretionary spending in less affluent markets, multiplying pressure on local retailers and smaller tenants. In mid- and lower-income ZIP codes, store closures, downsizing, and increased vacancy have become common.
Office (suburban, hybrid-first markets)
Markets that combine diversified job bases (finance + energy + tech) and flexible work cultures are recovering more quickly. In contrast, regions dependent on one-sector employment or older core downtowns are lagging in backfill, rent collection, and tenant stability.

What It Means for CRE Strategy
1. Portfolio Diversification Is No Longer Optional
In previous cycles, regional recessions could be offset by national recovery trends. In today’s patchwork economy, that buffer is gone.Tenants and landlords must diversify not just by geography but by sector resilience—for instance, industrial and logistics properties tied to e-commerce or data infrastructure tend to outperform service-heavy markets during regional contractions.
2. Focus on Financial Durability of Tenants
In “recession states,” credit risk rises even when occupancy remains steady.
Landlords should stress-test tenant rosters for exposure to vulnerable industries (agriculture, traditional manufacturing, discretionary retail) and prioritize longer-term leases with financially stable occupiers.
3. Reassess Rent Growth Expectations
Markets like Florida, Texas, and North Carolina can still sustain mid-single-digit rent growth, but secondary markets in the Midwest and Southeast may see flat or negative rent trajectories through 2026. Updating pro formas now prevents valuation shocks later.

4. Prepare for Cap Rate Divergence
As regional fundamentals split, cap rates will no longer move uniformly. Investors are already pricing greater risk premiums into stagnant or contracting economies.
Expect 50–100 basis point spreads to open between resilient and recessionary states by mid-2026.
5. The Flight to Quality Is Taking Many Forms
As the economic divide deepens, capital and occupiers alike are gravitating toward markets that demonstrate consistent growth, wage stability, and fiscal strength. This new “flight to quality” is not just about asset class—it’s about geographic quality. Investors are concentrating in states such as Texas, Florida, and North Carolina, where diversified economies and population inflows continue to support absorption and rent growth. Meanwhile, capital is retreating from regions in contraction, where slower job creation and fiscal pressure are eroding property performance.
Within each market, the pattern repeats: tenants are consolidating into newer, efficient, and well-located buildings that reduce operating costs and future-proof against economic swings, while older, commodity-grade assets face steeper vacancies and discounted pricing. The result is a widening performance gap both between states and within them—a two-tier market where liquidity, leasing demand, and valuation strength all concentrate in “quality” locations. For CRE strategists, understanding that flight pattern is now central to capital deployment and portfolio defense.
CRE Tech Insight: Data Over Headlines
For decision-makers, the biggest mistake is relying on national averages.
Tools like REoptimizer® are built to analyze localized real estate fundamentals, integrating leasing data, rent comps, and energy costs—so tenants and investors can pinpoint which markets still offer upside.
By aligning macro data (like Moody’s state-level recession analysis) with building-level intelligence, users can quickly see:
- Which facilities face higher renewal risk.
- Where expansion will deliver the best ROI.
- How regional energy and labor conditions affect occupancy cost.
This data-first approach is now essential to staying ahead of regional economic divergence.

Signals to Watch in 2026
- Utility and Power Infrastructure:
States investing heavily in power resilience (e.g., Texas, Arizona, and Nevada) are attracting both data centers and manufacturing tenants—stabilizing CRE demand even during economic cooling. - Consumer Credit Delinquencies:
Rising defaults in lower-income states will be an early indicator of retail and service-space stress. - Wage Momentum and Migration:
States that retain top quartile earners (Texas, Florida, Colorado) will likely remain CRE outperformers through the next cycle. - Public Incentives and Tax Policy:
Expect expanding states to continue courting industrial users through incentives, while fiscally stressed states tighten budgets—affecting project timelines and permitting.
The Takeaway: A Tale of Two CRE Markets
America’s economy is no longer moving in unison—and neither is its real estate market.
For every California, Texas, or Florida pushing ahead, there are multiple states retrenching or stalling.
For tenants, that means prioritizing stability, infrastructure, and labor quality over headline rents.
For owners and investors, it means favoring resilient metros and preparing for regional divergence in pricing, liquidity, and absorption.
Next Step: Rethink Your Portfolio Strategy with REoptimizer®
In a market where performance now hinges on the quality of your location and leases, precision beats scale. REoptimizer® empowers CRE leaders to quantify that divide—mapping every asset against real-time regional economic data, wage trends, and growth forecasts to reveal where portfolios are overexposed and where opportunity still runs ahead of the curve.
Pinpoint underperforming markets, model recession risk, and redirect capital toward regions still expanding. The economy may be fragmented—but your strategy doesn’t have to be.
Start your portfolio analysis today with REoptimizer®.
Successful commercial lease negotiation depends less on instinct and more on evidence. Data transforms negotiation from a subjective exchange into a quantifiable, defensible process.
Every metric within a commercial lease agreement can be measured, benchmarked, and optimized — and organizations that do so consistently outperform peers in cost control, flexibility, and risk reduction.
The following categories represent the most consequential data points in a commercial property lease. These are the levers that materially influence cost, exposure, and operational control.
Tenant Improvement Allowances
Tenant improvement (TI) allowances are one of the largest single variables affecting total occupancy cost.

2024 industry data shows that average TI packages for Class A offices fell roughly 9% year-over-year, to $98 per square foot.
This decline signals a shift: landlords are recalibrating incentives and embedding more capital recovery into base rent.
To negotiate effectively, tenants require benchmarking data ….not only on headline TI values but also on how landlords amortize those costs over the lease term. A nominally higher allowance can translate to higher rent if the landlord capitalizes the contribution into rent escalations. The key metric is effective rent per square foot, inclusive of amortized TI.
To quantify this impact, consider a standard 10-year commercial lease for 25,000 square feet of office space. If a landlord provides a tenant improvement allowance of $100 per square foot but amortizes it at 7% over the term, the embedded repayment raises the base rent by roughly $1.43 per square foot annually. Over the full term, the tenant effectively repays $357,500 in capital—often without recognizing it.
This phenomenon is widespread. A 2024 JLL corporate occupier report found that 63% of leases with high TI allowances included some form of amortization clause tied to rent escalation. In many cases, the allowance inflated total occupancy cost by 6–8% over the stated rent schedule. From a negotiation perspective, the difference between “landlord-funded” and “tenant-financed” improvements is not semantic; it’s financial.
Rent Abatement in Your Lease Agreement
Free rent periods have compressed across most U.S. markets.

Industry reports that average free rent on new leases fell from 9.6 months in 2023 to 8.9 months in 2024. In a negotiation, this contraction must be offset elsewhere — through lower rent, extended term flexibility, or expanded build-out concessions.
The relevant data point is abatement value as a percentage of total lease consideration. A balanced transaction aligns that ratio with market norms. Without that benchmark, tenants risk accepting nominal incentives that fail to offset underlying rent increases or reduced tenant improvements.
Operating Expenses and CAM Pass-Throughs
Operating expenses — including property taxes, insurance, utilities, and common area maintenance (CAM) — routinely account for 20–40% of total lease cost. They also remain the least transparent component of many commercial real estate leases.
Tenants should maintain longitudinal data on operating cost per square foot across their portfolio, segmented by building type and geography. Comparing those figures to market data identifies outliers where landlords may be passing through nonrecoverable capital items or management fees.
Negotiation objectives should include:
- Defined exclusions for capital improvements and administrative overhead
- Annual caps on controllable expenses
- Full audit rights for CAM reconciliations
Without data, these discussions default to anecdote; with it, they become quantifiable.

Effective Rent Analysis for Your Commercial Space
The only reliable measure of lease competitiveness is effective rent — the total cost of occupancy, incorporating rent, expenses, incentives, and escalations.
Formulaically:
Effective Rent = (Base Rent + Operating Costs + Property Taxes – Incentives) ÷ Square Footage
This metric neutralizes the distortions created by front-loaded incentives or artificially extended lease terms. A lease with higher nominal rent but stronger concessions may yield a lower effective rate over its duration. Comparing effective rents across transactions enables like-for-like analysis and eliminates reliance on headline figures.
Renewal Options and Termination Clauses
You can’t simply exit a commercial lease early because business conditions change. Unless you’ve negotiated a defined termination mechanism up front, you’re bound by the contract—and that rigidity can become expensive fast. A well-structured early termination clause is your release valve. It sets the notice period, the fee, and the process before there’s a problem. Without it, your only options are subleasing or default, both of which erode leverage and reputation.
Market data shows that structured break rights—typically requiring six to twelve months’ notice and a penalty equal to three to six months of base rent—can reduce portfolio exposure by as much as 8–10% in volatile markets. The precise numbers matter less than the presence of the clause itself. A contract that defines cost and timing gives you control; one that doesn’t leaves the landlord in full command of your flexibility.
Renewals carry the same risk in reverse. Too many tenants sleepwalk into extensions, assuming their existing lease terms remain competitive. They rarely are. If you signed a lease five or seven years ago, you negotiated in a different market—with different base rents, operating costs, and tenant inducements. The effective rent landscape has shifted.
Portfolio analytics should flag every upcoming renewal window at least a year in advance. Use that time to benchmark your current rent against market data and comparable commercial property leases. In 2025, national asking rents in prime office markets have declined by roughly 5–7% since their 2019 peak (CBRE), while tenant improvement allowances and free rent periods have also compressed. That means there is often room to renegotiate—not automatically renew.
A renewal option should be treated as a negotiation event, not an administrative step. Evaluate it with the same scrutiny as a new lease: reassess effective rent, operating cost allocations, and any new competitor clauses or maintenance responsibilities the landlord might introduce.
Holdover and Penalty Rent
Holdover provisions, which determine rent payable after lease expiry, often contain punitive rates of 150–200% of base rent. Data collected across a tenant’s portfolio typically reveals a more sustainable benchmark between 110–125%.
During negotiation, citing internal or industry averages reframes the discussion from anecdotal fairness to documented precedent. Every percentage above market is a predictable and avoidable liability.
Want a Favorable Lease? Come Prepared.
Every commercial lease negotiation should begin — and end — with data.Data exposes the true economics of every commercial property lease — how base rent, operating costs, and property taxes evolve across your leased space. It reveals whether your tenant improvements were properly amortized or if you’re effectively funding the property owner’s capital through a triple net lease, gross rent lease, or modified gross lease structure. It highlights unexpected costs, maintenance responsibilities, and rent increases that quietly inflate total cost over time.
REoptimizer® transforms that data into action. The platform automatically scans, flags, and benchmarks your lease terms across every office space and industrial property in your portfolio. It identifies when a commercial lease agreement includes non-standard escalation clauses, unfavorable competitor clauses, or missing renewal options. It quantifies how your net lease obligations compare to market norms, where landlord pays versus tenant pays, and when your square footage or lease duration exposes you to higher-than-average rent costs or maintenance costs.he system cross-references market benchmarks to surface favorable clauses, highlight negotiation opportunities, and help tenants negotiate lease terms from a position of data-backed strength.
In practice, that means no more “sleepwalking” into renewals or overpaying for a long-term lease negotiated in a different cycle. REoptimizer® provides the intelligence to identify potential risks, recalibrate lease options, and pursue lower rent or rent abatement where justified. It gives portfolio managers and experienced attorneys the tools to analyze legally binding contracts with precision — turning every complex process of negotiating a commercial lease into a disciplined, repeatable, data-driven workflow.
Your leases are more than contracts; they’re financial instruments. REoptimizer® ensures you treat them that way — by converting static documents into live intelligence.
Optimize every square foot. Reduce total cost. Negotiate every lease with data. Learn more about REoptimizer® can give your portfolio an edge.
The triple net (NNN) lease remains a standard structure among commercial assets, especially for industrial and flex properties.
It’s transparent, simple, and seemingly predictable: you pay base rent plus your share of taxes, insurance, and maintenance (CAM). The landlord receives a consistent return; you get operational control and visibility.
But under the surface, a triple net lease is anything but static. It’s a dynamic, variable-cost tied to three categories that can shift substantially over time. And as assets age, those shifts accelerate.
Across large-scale portfolios, this volatility can quietly erode margin, distort budgets, and complicate renewal strategies. What starts as a “known” rent structure can evolve into a moving target, especially if building age and efficiency aren’t properly priced into the deal.
The Exposure Built Into NNN Leases
In a triple net structure, the tenant assumes responsibility for most operational expenses beyond rent:
- Property taxes – influenced by municipal reassessments, mill rate changes, and local incentives.
- Insurance – dependent on asset condition, regional risk exposure, and claims history.
- Maintenance and repairs – the broadest and least predictable cost driver.
Think of these not as costs, but as variables. Each one flexes with market forces, landlord behavior, and building performance.

Industrial Implications
Industrial users face this most acutely. Because so many expenses are passed through (and many maintenance costs are tenant-managed) OPEX shifts with equipment performance, landlord practices, and even seasonal operating patterns.
For example:
- A well-managed 10-year-old distribution center might see maintenance representing 10–12% of total occupancy costs.
- A 25-year-old facility with deferred capital upgrades might see that figure approach 20%.
Across a multi-site network, that variance can translate into hundreds of thousands of dollars annually.
Why Age Matters
When you assume maintenance and operational responsibilities under a NNN lease, building age becomes a direct financial variable.
Older properties carry higher repair frequency, less efficient systems, and often, legacy components at or near end-of-life.
Deferred Maintenance
Landlords can potentially delay large capital replacements (roofs, paving, HVAC) knowing a NNN tenant will assume the burden. What looks like a competitive rent rate may mask upcoming expense spikes.
Energy and System Inefficiency
Industrial assets built before the mid-2000s frequently lack high-efficiency HVAC systems, modern insulation, and LED lighting. Energy intensity can be 15–30% higher than in newer buildings, based on Energy Star and DOE benchmarks for commercial facilities.

For tenants paying utilities directly, as most NNN structures require, these inefficiencies compound quickly. Over a 10-year term, the total energy delta can exceed any perceived rent discount on an older property.
Maintenance Escalation
Operating costs rarely move linearly. Maintenance spend tends to rise exponentially after major systems reach 15–20 years of service life. If the roof, mechanical, or electrical systems are near that threshold, your cost curve will steepen mid-term, not at renewal.
In short: A low base rent can conceal a high effective rent once age-adjusted costs are accounted for.
Modeling the Total Cost of Occupancy
The smarter approach is to model the total cost of occupancy (TCO) over the lease term, including projected OPEX and capital exposures.

Evaluate Life-Cycle Cost, Not Just Lease Cost
Run long-range scenarios incorporating:
- Age-based maintenance trajectories (roofs, HVAC, lighting).
- Historical tax reassessment rates.
- Insurance volatility (especially for high-value or older assets).
Even if your model relies on conservative industry averages, this exercise reveals where your “cheap rent” might actually produce the highest all-in occupancy cost.
Tie Tenant Improvement (TI) to Asset Condition
When negotiating, use asset age as leverage for TI or landlord contribution.
If the facility needs modernization — mechanical upgrades, dock levelers, lighting retrofits — push for shared investment. Landlords are often willing to fund improvements with residual life beyond your lease term, since they enhance asset value.
Clarify Maintenance Boundaries
Lease language must separate routine maintenance (tenant) from capital replacement (landlord). In older properties, this boundary line is critical.
If your HVAC unit fails due to age-related wear, is that “maintenance” or “replacement”? The answer determines whether it’s a $2,000 repair or a $200,000 capital burden.
Require Cost Transparency
Include lease clauses requiring detailed CAM statements and the right to audit pass-through charges. For larger occupiers, centralizing these audits portfolio-wide can reveal recurring discrepancies and recovery overcharges,
Control vs. Responsibility
One of the biggest appeals of NNN leasing is transparency. You see what you pay. You manage the vendors. You make the call on how and when to maintain the property.

But transparency doesn’t automatically equal predictability…and control doesn’t always mean freedom.
When you’re managing dozens or hundreds of leased properties, each with unique age profiles and expense structures, what feels like autonomy can become operational complexity.
Advantages:
- Cost Management: You can reduce spend through competitive bidding, proactive maintenance, and energy efficiency measures.
- Customization: You can align building operations with your specific needs — temperature ranges, security standards, logistics flow.
- Transparency: You know exactly where your money is going, line by line.
Disadvantages:
- Volatility: Costs for taxes, insurance, and repairs fluctuate.
- Administrative Burden: Managing service contracts, audits, and maintenance across multiple sites consumes internal resources.
- Age Amplification: The older your average building stock, the more unpredictable your expenses become.
For many portfolio managers, this trade-off defines the “hidden risk” of the NNN model.
Operational Discipline: Turning Exposure into Advantage
While NNN leases push more risk to the tenant, they also open opportunities for cost leadership (if managed systematically)..
By turning NNN lease data into structured intelligence, tenants gain a clearer picture of where costs are controllable — and where age or condition dictates inevitable drift.
For example:
- Preventive Maintenance Optimization: Regular HVAC tune-ups can extend system life 3–5 years and reduce emergency repairs by up to 30%.
- Energy Retrofits: Simple lighting and control upgrades can lower energy use by 10–20%, even in older industrial stock.
- Portfolio Insights: Identifying recurring overcharges or inefficiencies can unlock meaningful year-over-year savings without a single lease renegotiation.
These gains require visibility. Without data integration, most tenants never see the full cost pattern across their portfolios — they simply pay the bills.
The Strategic Shift: From Lease to Lifecycle Thinking
Portfolio performance lives beyond the lease document. Triple net leases make that explicit. You’re not just occupying space… you’re operating it. The financial outcome depends as much on the building’s physical condition and management efficiency as on the terms you negotiated.
That’s why sophisticated occupiers are evolving toward lifecycle-based portfolio governance, where each location is evaluated not just by rent or headcount, but by:
- Age and deferred maintenance risk.
- Energy intensity and upgrade potential.
- Cost volatility and exposure mapping.
- Renewal vs. relocation cost equivalency.
This is precisely where data-driven platforms like REoptimizer® move from helpful to essential — turning the “cost of occupancy” into a measurable, optimizable variable.
The Bottom Line
Triple net leases reward diligence and punish complacency. They give tenants visibility and control — but they also shift cost volatility and asset risk downstream.
Among rising maintenance costs, volatile insurance markets, and aging industrial stock, lease structure is strategy.
If you manage a large, mixed-age portfolio, make sure your team isn’t just negotiating rent — it’s modeling lifecycle exposure, tracking OPEX trends, and quantifying the real cost of age across your assets.
Because in a triple net world, the number on the lease is only half the story. The other half lives in the systems, surfaces, and line items that age reveals — quietly, and expensively.
Model the real cost of occupancy. Optimize with REoptimizer®. See what difference REoptimizer® can make across your portfolio.
Learn More
HVAC systems rarely get the spotlight in industrial real estate, but they should. They influence operating costs, worker safety, product quality, and energy performance — all of which shape a tenant’s total occupancy cost.
In warehouses, where air volume and environmental consistency are critical, HVAC can be both an efficiency driver and a financial risk. For tenants signing long-term leases, the difference between a system that performs and one that doesn’t can mean hundreds of thousands in unexpected expenses over the lease term.
Here’s what every tenant and corporate occupier should understand before committing to a space.
1. Capacity: Matching the System to the Space
HVAC capacity determines how well a system can maintain consistent temperature and humidity across a warehouse. When systems are undersized, they run constantly, fail to keep up, and degrade faster. Oversized systems waste energy and cycle inefficiently, creating temperature swings that affect both products and people.
Baseline formula for estimating cooling load:

This provides a general benchmark: roughly one ton of cooling for every 400 square feet. But it’s only a starting point. Real conditions often vary.
Variables that alter load requirements:
- Ceiling height: Each additional 10 feet of vertical clearance adds measurable air volume to cool or heat.
- Insulation quality: Poor insulation can raise energy demand by up to 25%.
- Machinery and lighting: Equipment and high-output LEDs generate significant internal heat.
- Occupancy: Worker density affects heat load and ventilation needs.
- Climate zone: Facilities in Phoenix or Dallas may require 30–40% more cooling capacity than those in Chicago or Denver.
Tenant takeaway: Always request the building’s mechanical drawings, commissioning reports, or a third-party HVAC load analysis before signing. If documentation is missing, assume further evaluation is necessary.
2. Efficiency Ratings: The Financial Impact of SEER and SEER2
HVAC efficiency is no longer a technical detail — it’s a financial metric that directly affects operating budgets.
The Seasonal Energy Efficiency Ratio (SEER) measures how efficiently an HVAC system delivers cooling per unit of electricity. Higher SEER means better performance and lower costs.
Efficiency scale:
- 8–12 SEER: Legacy, inefficient systems
- 13–15 SEER: Standard efficiency
- 16–20 SEER: High efficiency
- 21+ SEER: Best performance
Upgrading from 13 SEER to 18 SEER typically cuts annual HVAC-related energy costs by about 27%. In a 250,000-square-foot warehouse, that difference can exceed $50,000 per year.

The SEER2 Standard
Beginning in 2023, the U.S. adopted the SEER2 standard — a more realistic testing model that accounts for static pressure and airflow losses common in warehouse environments. SEER2 ratings appear slightly lower but reflect actual field performance.
- Northern regions: Minimum 14 SEER2
- Southern regions: Minimum 15 SEER2
- Performance difference: SEER2 values are roughly 4.5% lower than equivalent SEER ratings.
Tenant takeaway: A non-compliant system today means a costly retrofit tomorrow. During lease negotiations, confirm that all installed equipment meets SEER2 standards or secure commitments for upgrade credits.
3. Smart HVAC Systems: Technology and Control
Technology has fundamentally changed how industrial climate systems operate. Modern HVAC setups now integrate sensors, data analytics, and automation to fine-tune performance continuously.
Key innovations driving efficiency:
- IoT-Enabled Controls: Sensors monitor temperature, humidity, and occupancy in real time to maintain balance and avoid overcooling.
- Dynamic Demand Ventilation: Systems adjust airflow based on workforce density or process heat, reducing energy consumption when zones are idle.
- AI-Driven Thermal Mapping: Predictive algorithms identify hot spots before they escalate into performance issues.
- Load Shifting: Systems pre-cool or pre-heat spaces during off-peak utility periods to reduce demand charges.
- CO₂ and Air Quality Sensors: Automatically adjust ventilation rates to maintain safe conditions and lower energy waste.
Smart HVAC solutions can reduce energy consumption by 25–40% in large warehouses. They also improve indoor air quality — an often-overlooked factor in worker comfort and retention.
Tenant takeaway: When landlords promote “smart” or “energy-optimized” systems, ask for proof. Request performance data or maintenance logs to confirm the system is actively managed, not just automated on paper.
4. Airflow and Zoning: Where Efficiency Meets Comfort
Airflow dictates both energy efficiency and product safety. The key measurement is CFM (Cubic Feet per Minute) — how much air moves through the system.
Formula for calculating CFM:
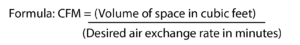
Uniform temperature distribution across a warehouse is nearly impossible without zoning. Different areas have distinct needs:
- Cold storage or food-grade areas: Require strict temperature and humidity control.
- Bulk inventory zones: Often need only minimal conditioning
- Shipping and receiving bays: High air exchange rates to manage temperature loss from open doors.
Adding zoning controls and high-volume low-speed (HVLS) fans can improve air balance and reduce total HVAC costs by 15–25%.
Tenant takeaway: Request an airflow map or temperature zoning plan as part of the due diligence process. Poor zoning often reveals itself later through uneven cooling, high bills, or worker complaints.
5. Lease Language: The Hidden Cost Center
In industrial leasing, HVAC responsibility is one of the most misunderstood — and expensive — clauses.
Tenant vs. Landlord Responsibility
- Triple Net (NNN) leases: Tenants typically bear full responsibility for HVAC upkeep, including repairs, maintenance, and eventual replacement.
- Gross or Modified Gross leases: Landlords handle basic maintenance but often pass through repair costs via operating expense clauses.
Before executing a lease, clarify two key provisions:
- System Condition at Move-In: Require inspection and certification from a licensed HVAC contractor. Without it, tenants risk inheriting a failing unit.
- Capital Expenditure vs. Maintenance: Define where routine servicing ends and replacement begins. Some landlords classify full system replacements as “maintenance” — a major financial exposure for tenants.
Tenant takeaway: Treat HVAC like a separate asset class within your lease. If you’re paying for it, manage it proactively.
6. Preventive Maintenance: The Cost of Neglect
An unmaintained HVAC system doesn’t just fail faster — it drives up energy use and emergency repair costs.
Recommended preventive maintenance checklist:
- Filter changes: Clogged filters increase energy use by 10–15% and strain fans.
- Refrigerant checks: Low refrigerant forces compressors to work harder, risking early failure.
- Duct and ventilation inspections: Blocked or leaking ducts cause uneven temperatures and wasted airflow.
- Belt and motor inspections: Worn belts or motors cause overheating, noise, and system inefficiency.
Regular inspections can extend system lifespan by up to 30%. High-dust environments such as textile, paper, or grain facilities may require more frequent service cycles.

Tenant takeaway: Require documentation. Maintenance logs should be attached to the lease or stored in your facility management system for audit and planning purposes.
7. The Financial Lens: HVAC as a Strategic Variable
Energy represents a growing share of warehouse operating costs — often 25–40% of total expenses. HVAC efficiency directly influences total occupancy cost and long-term competitiveness.
Incentives under the Inflation Reduction Act and regional energy programs now make high-efficiency upgrades more affordable. Tenants with multiple facilities can often qualify for tax credits or shared-savings models by retrofitting systems to SEER2 or higher standards.
Modernization benefits include:
- Lower utility spend and carbon footprint
- Improved lease renewal leverage through demonstrated efficiency
- Reduced downtime from system reliability improvements
For multi-site occupiers, benchmarking HVAC performance across locations highlights where inefficiencies or compliance risks are hiding in the portfolio.
Tenant takeaway: Efficiency data is negotiation leverage. The more you know about system performance and age, the more control you have over future costs.
REoptimizer® Insight
HVAC may sit quietly on the roof, but it drives some of the most dynamic cost variables in warehouse operations. Understanding system capacity, efficiency, maintenance history, and lease language gives tenants control over both energy and financial outcomes.
REoptimizer® helps occupiers quantify those variables across entire portfolios — identifying where outdated or mismanaged systems are inflating costs, exposing risk, or consuming unnecessary capital. With better data, tenants can negotiate smarter leases, plan upgrades strategically, and align facility performance with financial goals.
For tenants managing millions of square feet, small percentage improvements in HVAC performance translate directly into measurable savings. Every degree, every SEER point, and every maintenance cycle counts.
Learn more how REoptimizer® helps occupiers track HVAC performance, benchmark costs, and negotiate better leases.
Here’s the uncomfortable truth: most companies are still paying too much for office space. Even with record-high vacancies, remote work reshaping demand, and landlords offering concessions, many tenants are stuck in leases that don’t match today’s market reality.
Why? A toxic combo of legacy contracts, sticky asking rents, and landlords who’d rather hold the line than admit their space is worth less than it was in 2019.
And in some cities, the gap between what tenants pay and what space is actually worth is massive. These are the 10 U.S. markets where tenants are most at risk of overpaying in 2025.
1. San Francisco, CA
Vacancy Rate: 36%
Annual Rent: $65–$90 per sq. ft
San Francisco is the epicenter of office pain. Tech downsizing, remote-first policies, and a flood of sublease space have crushed demand. Yet asking rents in many towers haven’t budged.
That means companies locked into pre-pandemic deals are often paying double what new tenants could negotiate today. Even landlords desperate to fill space are reluctant to slash headline rents—they’d rather give free rent and tenant improvements than admit the market has collapsed.
If you’re a tenant here, benchmarking your lease against today’s comps is non-negotiable. Odds are, you’re overpaying.
2. New York City, NY
Vacancy Rate: 17–23%
Annual Rent: $75–$100 per sq. ft
Manhattan remains one of the most expensive office markets in the world, but here’s the catch: the “flight to quality” is leaving older buildings behind. Class A trophy towers still command eye-watering rents, while Class B and C space sits half-empty.
The problem? Landlords of those older buildings are refusing to cut rates, even as vacancy soars. So tenants end up paying for space that’s worth far less in today’s market.
Companies with leases signed before 2020 are almost guaranteed to be paying above-market—sometimes by 20–30%.
3. Seattle, WA
Vacancy Rate: 28–30%
Annual Rent: $35–$60 per sq. ft
Seattle’s once red-hot office market has cooled dramatically. Tech layoffs and hybrid schedules hollowed out demand, and yet asking rents for Class A space remain stubbornly high.
Landlords are quietly offering concessions—months of free rent, fit-out allowances—but headline rents make it look like the market hasn’t moved. For tenants who signed leases five years ago, this creates a double whammy: you’re paying top-dollar on paper and missing out on the incentive packages new tenants enjoy.
4. Los Angeles, CA (Downtown)
Vacancy Rate: 32%
Annual Rent: $50–$75 per sq. ft
Downtown LA is a classic case of oversupply meeting under-demand. Developers built big, tenants went remote, and now towers are sitting half-empty.
But here’s the kicker: landlords haven’t cut rents in proportion to the vacancy. They’re trying to hold the line, which means many tenants are stuck paying for space that simply isn’t worth what’s on the lease anymore.
Smart tenants are using the glut of space as leverage to renegotiate—but those who don’t are burning cash.

5. Washington D.C.
Vacancy Rate: 20%+
Annual Rent: $55–$75 per sq. ft
In D.C., the federal government props up Class A rents, even as private-sector demand shrinks. The result: a two-tier market where tenants in less desirable buildings are still paying inflated rates simply because landlords refuse to blink.
If your office isn’t in a trophy tower, you should be questioning every dollar of your rent bill right now.
6. Boston, MA
Vacancy Rate: 20–22%
Annual Rent: $60–$80 per sq. ft
Boston’s life sciences boom insulated the market for years—but cracks are showing. Vacancies are up, concessions are up, yet landlords are clinging to pre-pandemic rents.
Many tenants are paying for “lab premium” pricing on plain old office space. If you’re not in a prime cluster, odds are you’re overpaying.

7. Austin, TX
Vacancy Rate: 27%+
Annual Rent: $40–$46 per sq. ft
Austin was the darling of the post-pandemic office boom. Companies piled in, rents skyrocketed… and then remote work caught up.
Now vacancies are climbing, but landlords are dragging their feet on cutting rates. The tenants who signed at peak hype? They’re the ones footing the bill.
If you inked a lease here between 2021–2023, you’re almost certainly paying above-market.
8. Dallas, TX
Vacancy Rate: 23–26%
Annual Rent: $30–$35 per sq. ft
Dallas is a tale of overdevelopment. Developers bet big on growth, but demand hasn’t kept pace. Vacancy is up, and a wave of maturing loans in 2026 could make things worse.
For tenants, that means opportunity—if you’re willing to renegotiate. For those who stay passive, it means paying inflated rents while new deals are getting cut left and right.
9. Houston, TX
Vacancy Rate: 21%+
Annual Rent: $28–$36 per sq. ft
Houston’s office market has been shaky for years. Energy cycles, remote work, and overbuilding have kept demand soft. Yet rents in many towers remain anchored to past peaks.
The biggest culprit? Legacy leases. Tenants locked into deals from the oil boom years are paying way more than today’s space is worth.

10. Miami, FL
Vacancy Rate: 15%+
Annual Rent: $57 per sq. ft
Miami’s story is different: demand has been strong, driven by in-migration and finance. But here’s the problem—rents shot up so fast that they’ve outpaced reality. Older properties, especially outside the prime districts, aren’t worth the $57+ landlords are demanding.
In short, if you’re not in a shiny Brickell tower, there’s a good chance you’re overpaying.
Why Tenants Are Still Overpaying
If vacancy is sky-high and demand is soft, why aren’t rents plummeting? The truth is, office leasing isn’t a simple supply-and-demand equation. A mix of outdated contracts, stubborn landlord behavior, and a market that hasn’t fully recalibrated means tenants keep cutting oversized checks every month. Let’s break it down:
-
Legacy Leases: Trapped in Yesterday’s Market
Many tenants signed long-term leases between 2017 and early 2020—when office demand felt endless and rents were climbing. Those agreements often ran 7, 10, even 15 years. Fast-forward to 2025: rents in many markets have slipped, concessions have grown, and vacancy has exploded. But tenants locked into those deals are still paying peak-market rates.
Example: A company that inked a 10-year deal in downtown San Francisco in 2019 might be paying $80 per sq. ft today—when comparable space is quietly being marketed in the $55–$60 range with months of free rent. That gap translates into millions in wasted overhead over the life of the lease.
-
Landlord Psychology: Refusing to Blink
On paper, landlords should be slashing rents to lure tenants back. In reality, many refuse. Why? Because cutting headline rents triggers an immediate hit to property values. If rents drop, appraisals drop. And with $1.5 trillion in CRE debt maturing by 2026, landlords know lower valuations could trigger defaults.
Instead, landlords cling to “ask high, deal later.” They keep sticker prices elevated—even when everyone in the room knows they’re inflated. The result? Tenants who don’t push hard enough end up paying those inflated numbers.
-
Concessions Over Cuts: The Smoke-and-Mirrors Game
Even when landlords are flexible, they prefer offering concessions instead of lowering face rents. You’ll see packages like:
- 6–12 months of free rent
- Generous tenant improvement allowances
- Parking discounts
Those perks help new tenants, but they don’t fix the core issue: the lease rate is still artificially high. For existing tenants who don’t renegotiate, concessions often aren’t even on the table. That creates a two-tier market where new tenants capture the real value, and legacy tenants keep paying the premium.
-
Remote Work Reality: The Market Has Changed Forever
The elephant in the room is that office demand will never return to pre-2020 levels. Hybrid and remote work have structurally reduced the need for space. National utilization hovers around 50–60% of pre-pandemic norms. Yet, landlords are pricing space as if full return-to-office is just around the corner.
That misalignment means effective market value is lower than asking rents suggest—but only the most informed tenants recognize it.
How Tenants Can Fight Back: Benchmarking Is the Weapon
Here’s the good news: tenants are not powerless. The key is benchmarking—comparing your current lease against real-time market data to see whether you’re paying above (or below) what space is truly worth.
This is where REoptimizer® comes in. Instead of relying on stale comps or landlord marketing decks, REoptimizer®:
- Surfaces real-time rent benchmarks across markets, down to submarket and building class.
- Flags overpayment risk by showing how your current lease stacks up against today’s deals.
- Models negotiation scenarios so you can walk into renewal talks with data, not guesses.
- Reveals hidden costs—from CAM clauses to escalation terms—that inflate your total occupancy spend.
In other words, REoptimizer® turns lease benchmarking from a back-of-the-napkin guess into a precision tool. Tenants no longer have to wonder if they’re getting fleeced—they’ll know.
The Bottom Line
Across San Francisco, New York, Miami, and beyond, tenants are losing millions each year simply because they don’t have visibility into what office space should cost. Legacy leases, landlord gamesmanship, and the post-pandemic reset all add fuel to the fire.
But benchmarking software flips the script. By seeing the market clearly—and renegotiating from a position of strength—tenants can finally stop overpaying and start aligning their office costs with reality.
If you haven’t benchmarked your lease in 2025, you’re almost certainly paying too much. If you want more information on how REoptimizer® simplifies benchmarking your portfolio while giving it the edge you need, click the link below.
If you’re watching where households (and capital) are heading in 2025, the story is impossible to miss: Texas is dominating the rest of the country.
In a new GoBankingRates study of the 50 fastest growing cities with the most affordable climates in America, Texas claimed 12 slots on the list, including #1 overall (Frisco). That’s nearly a quarter of the country’s top performers in one state.
And this rapid growth isn’t concentrated among the usual suspects and larger cities like Austin. Secondary and even tertiary markets (Denton, Edinburg, Killeen) are showing the kind of population and affordability dynamics that investors can’t afford to ignore.
For portfolios, this isn’t just trivia. It’s a roadmap of where cash flow, population changes, household spending power, and long-term demand curves are heading.
Most Alluring State? Texas Wins By Far.
With 3 Texan cities ranking on the list of top 5 and 6 out of the top ten, the Lone Star domination is hard to ignore.
Let’s look a bit deeper at the headline stats of the fastest growing cities.
- Frisco, TX (#1): 26.9% five-year population growth, 4% one-year growth. Median income $146K, with renters spending just under $47K/year on total living costs.
- McKinney (#3): 16.6% growth over five years, strong income-to-cost spread.
- Allen (#5) and League City (#7): steady gains with homeowners keeping meaningful leftover savings after expenses.
- Round Rock (#10): riding Austin’s halo but still under national cost averages.
Even Austin (#35) makes the cut despite its reputation for pricing out locals… proof that the Texas affordability narrative still holds weight when benchmarked against national averages.
The point? Texas is delivering growth at every level of its metro hierarchy. For portfolio owners, this strong economy means opportunities not just in major urban hubs but in adjacent secondary markets that punch well above their weight.

Population Growth in the Sunbelt
Step back and the broader Sun Belt migration machine is still firing.
With the fastest growing cities, Arizona placed Goodyear (#2), Chandler (#18), and others.
Florida slipped in Lakeland (#37) and Jacksonville (#50). North Carolina, Nevada, Tennessee —all showing up.
The Sun Belt’s momentum isn’t a blip — it’s the continuation of a multi-decade demographic shift that accelerated post-2020.
Fueled by affordable housing, pro-growth tax regimes, year-round warm weather, and diversified job creation in industries like healthcare, logistics, and tourism, the region continues to pull new residents away from high-cost coastal hubs — and it’s doing so at a pace that looks structural, not cyclical.
But Texas’s dominance is different. And of course the warm weather and no state income tax helps. Beyond even those pulls, its really the combination of affordability, economic diversity, and infrastructure capacity that creates a flywheel effect:
- Affordability keeps households moving in.
- Corporate relocations (tech, logistics, manufacturing) create job anchors.
- Municipal tax bases expand, funding further growth.
When you can map that cycle across a dozen cities in one state, you’re looking at a structural advantage, made more tangible by dozens of corporate headquarter relocations.
What the National Data Is Really Telling Us
The study boils the analysis down to two questions investors should care about:
- Are people moving in? (short- and long-term population growth)
- Can they actually afford to live there? (income versus rent or mortgage costs)
When you overlay those metrics with data from Zillow, BLS, and the Fed, the signal is straightforward: markets with both rising demand and household spending capacity are the ones positioned to outperform.
Put differently: growth without affordability is a bubble; affordability without growth is stagnation. The winners are the cities that deliver both.
New Residents Flock to Areas of Low Taxes
It’s not just rents and mortgages pulling people south. States like Texas, Florida, and Tennessee levy no personal income tax, creating thousands in annual savings for households earning $120K+. But the calculus goes deeper:
- Corporate income taxes are lower or nonexistent in many Sun Belt states, making them magnets for relocations and expansions.
- Sales and property tax structures often shift the load in ways that still net out cheaper for both households and employers compared to high-tax states.
- Regulatory environments are leaner, reducing cost and friction for growth industries like tech, logistics, and manufacturing.
This creates a double arbitrage: households boost disposable income while companies improve margins — a powerful flywheel for sustained in-migration and job creation. Migration today isn’t just about chasing employment opportunities; it’s about optimizing the after-tax, after-housing equation for both workers and the firms that employ them.
For investors, that means tax regimes aren’t just background noise: they’re a material factor in underwriting and portfolio strategy.
Portfolio Implications: Benchmark to Fastest Growing Places or Fall Behind
If you’re holding or acquiring assets, the implications are clear:
- Benchmark Growth vs. Affordability: Where do your markets sit relative to these trends? Are households in your metros gaining ground, or losing it?
- Spot the Halo Markets: Don’t just chase Austin — look at Round Rock, Denton, and Killeen, where spillover growth comes with better entry pricing.
- Stress-Test Rents Against Incomes: Rising incomes in Frisco can support rent escalations. Stagnant income growth in other metros? That’s where concessions creep in.
- Factor in Tax Competitiveness: Net in-migration is disproportionately favoring low-tax states. That’s structural, not cyclical.
Sophisticated portfolios already know: demographics lead demand, and affordability caps it. If you’re not tracking both, you’re flying blind.
The Bigger Picture: The Last Decade Redraws the U.S. Growth Map
What’s happening in 2025 is a reshuffling of the U.S. growth deck. Coastal gateways are still magnets for capital, but the real velocity is shifting inland and southward. Secondary markets are no longer “alternative plays” — they’re becoming the main show for yield, stability, and household growth.
And here’s the kicker: these aren’t temporary pandemic-era relocations. This is structural realignment, reinforced by policy, tax, and affordability advantages. Texas is just the clearest example.
Population growth is aligning with affordability, and how that combination is redrawing the U.S. growth map.
From larger cities like Fort Worth and Austin to smaller communities such as Round Rock or Denton, the data shows a clear migration pattern: households and businesses are seeking out affordable housing, strong economies, and year-round lifestyle advantages.
The data couldn’t be clearer. Households are migrating. Costs matter. Taxes matter. And the winners are metros that marry growth with affordability.
If your portfolio strategy isn’t benchmarking against these shifts, you’re not just missing opportunity — you’re taking on risk you may not even see yet.
That’s where REoptimizer® comes in. We help you benchmark your assets against demographic and cost trends, population growth, track migration corridors, and model tax impacts — so you’re not reacting to change, you’re getting ahead of it.
REoptimizer®: Your Edge in Fast-Growth Markets
If you’re managing assets in this environment, the challenge is simple: are you positioned where the growth is?
With REoptimizer®, you can track population data, growth rates, tax regimes, and affordability trends across metro areas and smaller city markets alike.
Whether it’s new residents moving into Sun Belt regions in the coming years, or service industries expanding in secondary markets, we give you the tools to compare, stress-test, and benchmark against national data and regional shifts.
The fastest-growing places in the country are pulling capital, families, and industries at record speed. Don’t just watch the trend — explore it, measure it, and align your portfolio with it.Optimize now, before the market does it for you. If you want a deeper look into how REoptimizer® can supercharge your portfolio, click the button below for more information.
Industrial real estate has been on a wild ride over the past decade. From the e-commerce boom to pandemic-era supply chain reshuffling, warehouses and logistics hubs have gone from the quiet backbone of the economy to one of the most closely watched property sectors.
If you thought the industrial boom was slowing down, think again. Despite national rent growth averaging just 1.6% this year, some U.S. cities are bucking the trend in spectacular fashion.
According to CoStar’s September 2025 data, the top five metros leading the pack in industrial real estate rent growth are:
- Nashville, TN
- Charlotte, NC
- Orlando, FL
- Columbus, OH
- Washington, DC
These metros are seeing industrial asking rents rise at multiples of the national pace…So, let’s break down what’s driving the surge, why it matters, and what it signals for investors, occupiers, and developers.
Nashville: Music City Becomes Logistics City
Almost overnight, Nashville has become one of the most sought-after logistics markets in the U.S.

Nashville tops the charts with 6.7% annual rent growth, catapulting average asking rents to $12.19 per square foot—the highest in the Southeast. To put that in perspective, rents here are nearly 18% higher than Atlanta, long a heavyweight in the region.
But what’s behind Nashville’s rise?
- Population & Labor Boom: Among the fastest-growing metros in the country, Nashville’s influx of people and companies fuels demand for distribution and logistics space. With this comes a major labor market expansion fueled by corporate relocations and young workforce inflows
- Massive infrastructure investments—from airport expansions to interstate improvements
- Construction Challenges: Rocky soil and tricky topography make building expensive. Developers pass on those costs, inflating asking rents.
- Supply Dynamics: With 2 million square feet under construction—the most since Q3 2023—new supply is on the way, but not enough to dent landlord leverage yet.
Here’s the twist: demand has cooled slightly since early 2024. Net absorption (move-ins minus move-outs) has slowed, even as vacancies hover around a tight 6.1%. Some deals are stalling under the weight of elevated rents.
Even so, Nashville has logged 50% rent growth in the past five years, crushing the national average of 36%. E-commerce players and third-party logistics firms are clamoring for modern space. Forecasts suggest growth will cool to ~4% in late 2025 and 2026 before stabilizing—but in such a tight market, it’s unlikely tenants will find relief anytime soon.
Charlotte: The Big-Box Comeback
Charlotte is riding the wave of big-box leasing—where major tenants absorb vast footprints for logistics. This surge has pushed rents up nearly 6.5% annually, well above peer markets. It has rapidly become an industrial powerhouse of the Southeast.
Its location is no small factor: Charlotte sits at a strategic crossroads for logistics operators serving the Southeast, with easy access to major interstates, ports, and rail networks.
The result? Tenants are competing for limited space, driving rents upward. For institutional investors, Charlotte has become one of the most competitive industrial markets in the U.S., and it’s not slowing down.
- Absorption: Space is disappearing as fast as it’s built. Net absorption consistently outpaces expectations.
- Pipeline Pressure: The construction pipeline is shrinking, which means fewer new buildings to absorb growing demand.
- Strategic Advantage: Charlotte sits at a crossroads for Southeast distribution, making it a must-have for logistics players.
For tenants, Charlotte is a frustrating game of musical chairs. For landlords and investors, it’s music to their ears.
Orlando: Sunshine and Supply Chain Pressure
Orlando’s industrial story is about more than just theme parks. The Central Florida market has quietly become a logistics hotbed.
Key Drivers:
- Population Surge: Central Florida’s demographic expansion drives consumption and logistics needs.
- Sector Diversity: Demand isn’t just e-commerce—it’s aerospace, defense, and advanced manufacturing.
- Constrained Supply: Limited new construction has left high-quality facilities in short supply.
Vacancies remain tight, and leasing velocity is accelerating. Landlords have a strong upper hand in negotiations, and tenants looking for modern, Class A distribution space often find themselves facing bidding wars.

The bigger takeaway: Orlando is no longer just a regional logistics hub; it’s becoming a national player thanks to its diverse demand base.
Columbus: The Midwest Logistics Titan
If Nashville is hot and Orlando is up-and-coming, Columbus is the steady workhorse of industrial rent growth. It’s one of the most strategically important industrial markets in the country. Rents are up ~5.7% annually, making it the Midwest’s strongest performer.
Key Drivers:
- Location, Location, Location: Within a day’s drive of half the U.S. population, Columbus is indispensable for e-commerce and logistics networks.
- Big Tenant Deals: Large-scale logistics and manufacturing commitments are squeezing availability.
- Supply Balance: Construction is steady, but demand remains stronger.
Even with new construction underway, absorption is outpacing supply. Columbus has long been viewed as a “must-have” logistics market, but today it’s showing elite-level rent growth that rivals coastal metros.
For occupiers, this means Columbus is no longer a “cheap alternative”—it’s a competitive battleground where timing is everything.
Washington, DC: A Different Kind of Demand
The Washington, DC industrial market is a fascinating outlier. While the apartment sector there has softened, industrial demand remains rock-solid. Reaching an annual Rent Growth: ~5.6%, key drivers include:
- Defense & Federal Logistics: The government’s outsized footprint ensures steady space absorption.
- Distribution Role: DC serves both local consumption and broader Mid-Atlantic logistics.
- Vacancy Stability: Even as supply enters the market, vacancies remain tight.

In short, the federal government’s presence provides a built-in demand engine that insulates DC’s industrial sector from broader market slowdowns. For investors, it’s one of the few markets where industrial real estate behaves almost like a defensive asset.
Beyond the Top Five: Other Strong Performers
While Nashville, Charlotte, Orlando, Columbus, and DC are the headline-makers, several other metros deserve attention:
- Louisville, KY (~5.5%): Anchored by UPS’s Worldport, Louisville remains one of the nation’s premier air freight hubs.
- Milwaukee, WI (~5.4%): Steady growth driven by manufacturing and Midwest logistics positioning.
- St. Louis, MO (~4.3%): Strategic Mississippi River location fueling demand.
- Tampa, FL (~4.2%): Growth tied to population expansion and Gulf Coast trade.
- Philadelphia, PA & Chicago, IL (~4%): Large, mature markets where steady demand keeps rents climbing, though at a more moderate pace than the high-flyers.
The Bigger Picture: Why This Matters
So what’s the common denominator across these markets? Three themes emerge:
- Population Growth = Warehousing Demand
- Cities like Nashville and Orlando are seeing demographic booms that directly translate into more goods flowing in and out.
- E-Commerce and Logistics Power
- Columbus, Charlotte, and Louisville benefit from their strategic locations for national distribution.
- Constrained Supply Pipelines
- Even as construction has surged, supply is struggling to keep up with tenant demand, giving landlords pricing power.
In short, industrial real estate remains the darling of commercial property because it sits at the intersection of demographics, technology, and logistics—a trifecta few other asset classes can claim.
Final Word for Industrial Tenants
Industrial real estate is one of the hottest, active markets right now and when demand collides with constrained supply, rents don’t just rise; they soar.
But the race isn’t just about finding space anymore…it’s about knowing where and when to act.
Markets are moving fast, and tenants who benchmark against yesterday’s numbers risk locking themselves into costly deals that don’t reflect today’s realities.
That’s why benchmarking the is your competitive advantage. By tracking real-time rent growth, vacancy, and construction pipelines, companies can identify when to negotiate, where to expand, and how to avoid overpaying.
This is exactly where REoptimizer® comes in. Our platform empowers occupiers to:
- Benchmark markets with live, data-driven insights
- Spot opportunities in high-growth regions before competitors do
- Negotiate smarter by arming teams with transparent, comparable data
- Align portfolios with shifting population and logistics trends
Industrial real estate may be red-hot, but with the right tools, you don’t just keep up—you capitalize on growth.
Because in this market, the winners won’t just be those who secure space. The winners will be those who optimize it. Learn more today about how REoptimizer® can give your industrial portfolio a razor sharp edge Act before your competition does.
