As we move through 2026, the mandate for corporate occupiers has shifted. Whether managing high-density office space or sprawling warehouse networks, the goal is to align footprint with economic growth while mitigating the rising costs of occupancy in a booming market.
And now, the current real estate landscape is no longer about recovery; it’s about capitalizing on growth. 2025 marked the third consecutive year of growth, with $472.6 billion in transactions—a 19.9% surge in total dollar volume. A lot of these investments were concentrated in certain cities where market conditions have paved the way for more sustained real estate growth.
So, without further ado, here are the top markets to keep pay attention to and the key factors that make them such strong players.
Best City Real Estate Investment: Dallas-Fort Worth
Dallas-Fort Worth has solidified its position as the primary anchor for national portfolios. With $22.3 billion in activity, it is currently the benchmark for the best city real estate investment based on liquidity and corporate migration.
- Macro Indicators: Deals climbed 3.9% while dollar volume rose 6.6%, indicating a tightening, highly competitive environment.
- Occupier Advantage: Outside of industrial, nearly every property type is seeing positive results, making it an ideal hub for diversified regional HQs.
- Strategic Outlook: Tightening bid-ask spreads suggest that the window for aggressive lease negotiations is closing as investor conviction builds for an “accelerated 2026.”

The San Francisco Bay Area
Surprised?
After a tumultuous few years, the Bay Area proved its structural importance in 2025, closing the year with $20.5 billion in real estate investment.
This 24.6% increase in dollar volume signals that institutional capital is doubling down on the world’s premier innovation hub.
- Momentum: A robust surge in activity between Q3 and Q4 suggests a “flight to quality” that corporate tenants must navigate.
- Talent Density: With a 16.2% increase in transactions, the competition for trophy office space is intensifying, requiring occupiers to move with higher velocity.
Los Angeles
Los Angeles is playing a long game. While the fourth quarter showed a slight cooling, the annual growth of 21.8% in dollar volume highlights the city’s enduring status as a critical node for logistics and entertainment.
- Industrial Resilience: L.A. remains a top-tier choice for those looking to buy rental property or industrial hubs due to its proximity to global trade routes.
- Growth Profile: An 11.1% increase in transaction count suggests a healthy, active market.
- Occupier Takeaway: The “measured” nature of the recovery allows for more strategic, data-driven site selection compared to more volatile hubs.

New York City
New York’s $18.8 billion in activity reflects a stabilizing giant. While dollar volume increased by only 1.1%, the city’s undisputed lead in job growth ensures that high-scale tenants remain anchored to the Manhattan core.
- Transaction Stability: A 5.1% rise in deal count shows a healthy market “churn,” allowing for strategic consolidation and “blend-and-extend” lease opportunities.
- Executive Takeaway: NYC remains the gold standard for portfolio stability, even as high-growth “sunbelt” cities capture the headlines.
Real Estate Momentum in Miami
Miami is the outlier in terms of pure velocity. Total volume surged 34.7% in 2025, underscoring massive confidence across all property types.
- The Inbound Wave: Transactions jumped 15.5% as the “Wall Street South” trend translates into long-term real estate commitments.
- The Cost of Confidence: This is a seller’s market. Occupiers need sophisticated data to avoid over-leveraging in a region where prices are detaching from historical norms.
Housing Demand: The Phoenix and Las Vegas Shift
Both Phoenix and Las Vegas represent the intersection of housing demand and commercial expansion. While Phoenix saw a 2.8% rise in transactions, Las Vegas continues to evolve into a diversified corporate player, moving well beyond its hospitality roots.
- Phoenix Turnaround: Analysts describe the 18% decline in dollar volume as “subtle growth,” indicating a market reset that could offer a high potential return for those entering in early 2026.
- Secondary Market Strength: These different locations are no longer “alternatives”—they are core requirements for logistics-heavy portfolios.
Booming Market Trends: Denver and Austin
Investors remain “increasingly optimistic” about Denver, where deals rose 20.8% and volume climbed 30.1%. Austin, meanwhile, saw a 40.7% leap in total volume despite a slight dip in transaction count.
- Concentrated Capital: Austin’s volume leap suggests that when corporations buy real estate in the region, they are investing in large-scale, tech-centric campuses.
- Long-term Fundamentals: Both cities lead the nation in economic growth per capita, making them essential for any high-growth portfolio.
Best Cities for Strategic Value: D.C., Atlanta, and Chicago
Performance in major metropolitan areas is not monolithic, offering “value play” opportunities:
- Washington, D.C.: A “bid-ask disconnect” has led to an 11.6% drop in volume despite more deals closing. For tenants, this is a prime opportunity for landlord-funded capital improvements.
- Chicago: An 18.2% increase in transactions shows investors capitalizing on lower office asset prices.
- Atlanta: Despite a 15.2% volume dip, the market is primed for “positive investment momentum” as it recalibrates for 2026.
Why “Housing Demand” is a Commercial Problem
For large-scale tenants, housing demand is a critical supply-chain issue. If the workforce cannot find affordable housing near your warehouse or office, your operational resilience is at risk.
The best cities for corporate expansion are those that successfully balance commercial job growth with residential supply. This is why savvy C-Suite leaders are now monitoring multifamily investment trends as a leading indicator of talent mobility and labor costs.
Strategic Challenges for Large-Scale Portfolios
Managing a national footprint of office and warehouse space across different locations involves three critical hurdles:
- The Bid-Ask Disconnect: Navigating the gap between landlord expectations and market reality requires hard data.
- Market Granularity: Knowing when to buy real estate in a high-conviction market like Austin versus waiting for a turnaround in Charlotte (where volume fell 21.8%).
- Portfolio Optimization: Ensuring that every square foot is actively contributing to the company’s potential return.
The REoptimizer® Edge: Turning Data into Leverage
In a market where total volume is approaching $500 billion and transactions are rising by nearly 20% year-over-year, spreadsheets are no longer sufficient. REoptimizer® is the critical transaction management and portfolio optimization software designed specifically for the corporate occupier.
- Centralized Intelligence: Benchmark your leases against the 30,425 transactions currently shaping the major metropolitan areas.
- Strategic Execution: Whether you need to lease or buy real estate for a new regional hub or optimize a legacy warehouse, our platform provides the transparency needed to close the “bid-ask disconnect.”
- Yield Optimization: Align your footprint with job growth and economic growth metrics to ensure your real estate is a strategic asset, not a sunk cost.
- Hyper-Localized Site Selection: Layer over 200 granular data points—from commuter patterns and traffic density to local infrastructure—on a single map to pinpoint properties that align with operational requirements and talent accessibility.
The 2026 market is an “operator-led” environment, and for corporate occupiers, the margin for error has never been thinner. The best cities for expansion are no longer determined by intuition, but by the intersection of demographic data and capital flows.
Those who utilize professional software to navigate these major metropolitan areas will be the ones who capture the most value while others are still catching up to the data.
Is your portfolio ready for the 2026 surge? Schedule a demo with REoptimizer® today to see how we help the world’s leading occupiers dominate the market through data.
Book a Demo
In the current commercial real estate landscape, the traditional lease audit is evolving. High-level corporate tenants are no longer just looking at their own square footage; they are looking at the property’s profitability.
For a tenant in a high-rise office or a sprawling warehouse, the landlord’s net operating income (NOI) is the heartbeat of the building. If that heartbeat flutters, your services—from security to climate control—are the first to suffer. Understanding how to calculate net operating income is no longer just for commercial real estate investors; it is a critical survival skill for portfolio managers.
Net Operating Income: The Tenant’s Risk Barometer
Net operating income is a fundamental valuation metric that measures a property’s income after deducting operating expenses but before financing and taxes. For a tenant, a healthy net operating income noi signifies a landlord who has the liquidity to reinvest in the building. Conversely, a shrinking NOI suggests a landlord who may be forced to cut corners on property management and essential operating costs.
Formula of Net Operating Income
To understand the financial health of your building, you must look at the formula of net operating income. At its simplest, the net operating income formula is:
While real estate investors use this to determine property value, tenants should use it to gauge operational performance. If the operating expenses are being artificially suppressed to prop up the NOI, the “deferred maintenance” bill is quietly growing—and you will eventually pay it through poor service or emergency escalations.

Gross Operating Income: More Than Just Tenant Rents
The first step in the noi calculation is determining the gross operating income. This represents the total revenue the property generates if it were fully functional, minus vacancy losses.
Gross income includes:
-
Tenant rents: The primary rental income.
-
Ancillary income: Revenue from parking fees, laundry services (in flex/mixed-use), and communications infrastructure.
-
Additional income: Vending, signage, and other revenue generated by the asset.
A landlord struggling with revenue growth in tenant rents may become aggressive with ancillary income or “nickel-and-diming” tenants on administrative costs.
Calculate Net Operating Income: Peeling Back the Expenses
To calculate NOI accurately, you must understand what qualifies as an actual cash expense. To arrive at the actual NOI, the property owner subtracts total operating expenses from the gross income.
Common operating expenses include:
-
Property taxes and income taxes (where applicable).
-
Property management fees and maintenance fees.
-
Insurance and utilities.
-
Operating costs for common areas.
Crucially, net operating income does not include financing costs, debt payments, interest payments, or capital expenditures. This is where tenants get tripped up: a building can have a “positive” net operating figure while still being in a cash-flow crunch due to high interest rates on its loan payments.
Net Income vs. Net Operating Income
It is vital to distinguish between net operating results and net income. While net operating income focuses on the property’s ability to generate cash flow from operations, net income is the “bottom line” after all business expenses, including interest expense and debt service payments.
If a landlord’s net income is negative despite a positive NOI, the property is likely over-leveraged. REoptimizer® helps you spot these discrepancies by comparing your building’s financial efficiency against comparable properties in the property’s market.

Cap Rate: How NOI Dictates Property Value
The cap rate (or capitalization rate) is the link between net operating performance and market value.
For the tenant, the cap rate is a signal of risk. A very high cap rate compared to the property type average may indicate a “value-add” property where the landlord is desperately trying to calculate noi increases by slashing property’s operating expenses. This often leads to a decline in operational efficiency and a poor tenant experience.
Calculate NOI to Predict Tenant Improvement (TI) Capacity
One of the most practical reasons to calculate net operating income is to assess a landlord’s ability to fund tenant improvements.
If the NOI calculation example for your building shows a tightening margin, the landlord likely lacks the net profit to offer competitive TI packages. They may even struggle to fund capital expenditures like elevator modernizations or HVAC overhauls, which are not included in noi but are essential for actual profitability.
Managing Multiple Properties with REoptimizer®
In a large-scale portfolio, manually reviewing the income statements for every rental property is impossible. This is where REoptimizer® becomes your most valuable asset. Our software allows you to:
-
Benchmark Operational Performance: Compare the operating profitability of your landlords across multiple properties.
-
Flag NOI Instability: Automatically detect if total operating expenses are out of sync with market trends.
-
Audit Property Management Fees: Ensure you aren’t overpaying for management fees that aren’t translating into operational efficiency.
-
Visualize Cap Rate Compression: Understand how property value shifts affect your landlord’s ability to maintain the investment property.
The REoptimizer® Advantage: Beyond the Spreadsheet
Don’t let your commercial real estate strategy be dictated by a landlord’s hidden financial strain. By understanding the formula of net operating income and utilizing REoptimizer® to monitor noi calculation trends, you shift the power dynamic back in your favor.
Are you ready to audit your portfolio’s true risk?
REoptimizer® provides the tools to see through the gross income and find the actual cash expense realities of your landlords. We help you identify the “red zone” properties where operating income is insufficient to support long-term property’s profitability.
Book a demo today for a data-driven portfolio review. Let us show you how to use NOI insights to secure better lease terms and protect your operational future.
Chicago’s office market is often described with one word: challenged. But that framing misses the nuance. A closer look at where tenants are actually leasing—and where vacancy is concentrating—tells a much more strategic story, one that matters not just for Chicago, but for office decisions nationwide.
Beneath the narrative of high vacancy and “office distress,” the data reveals a market that increasingly rewards scale, flexibility, and decisiveness.Here’s what enterprise occupiers should understand about Chicago today—and how it should inform broader portfolio strategy.
Chicago Is A Two-Tier Office Market—And Tenants Control The Top Tier
Chicago’s overall CBD vacancy remains elevated, but the newest Class A buildings are operating in a different reality.
-
Newest Class A CBD buildings: ~8% direct vacancy
-
Overall Chicago CBD: ~22%+ direct vacancy
For large occupiers, this matters because your negotiating leverage is strongest where demand is most concentrated. Even in the best buildings, availability exists—but it’s uneven, lumpy, and often tied to single large move-outs.
Translation: Top-tier space is leasing—but it’s not scarce yet. That window will not stay open forever.

Flight-To-Quality Is Really A Flight-To-Operational Efficiency
For large corporate tenants, quality is not about finishes—it is about outcomes.
Newer Class A buildings in Chicago consistently outperform because they support how modern enterprises actually operate:
-
Floorplate efficiency allows teams to function with fewer square feet per employee without sacrificing experience.
-
Mechanical and electrical systems support higher densities, flexible layouts, and evolving technology requirements.
-
Amenity ecosystems improve attendance and utilization in hybrid environments.
-
Location clustering reduces friction for distributed teams and clients.
Many large tenants relocating into top-tier buildings are doing so while reducing total square footage. In several cases, the net occupancy cost remains flat—or even declines—despite higher face rents.
This is a critical nuance:
The office is shrinking, but its strategic importance is increasing.
Chicago’s best buildings allow enterprises to align real estate with workforce strategy, not simply house employees.
Large Availability Blocks Are Real—And Highly Strategic
One of the most misunderstood elements of the current Chicago market is the presence of large availability blocks in otherwise top-performing buildings.
These blocks are not signs of broad-based weakness. Instead, they are the byproduct of:
-
Law firm relocations into newer trophy towers
-
Corporate consolidations following M&A
-
Long-term portfolio rationalization decisions now coming to fruition
For large occupiers, this creates rare, transaction-specific opportunities:
-
Single-building solutions exceeding 100,000 SF
-
Ability to negotiate bespoke economics, concessions, and flexibility
-
Potential for brand-defining relocations without speculative construction risk
However, these opportunities are episodic, not permanent. Once absorbed, replacement options of similar scale may not exist—particularly with new development effectively paused.
The implication: Timing and preparedness matter more than market cycle positioning.

Sublease Inventory Is Not A Red Flag—It’s A Tool
Sublease availability remains elevated in Chicago, including within high-quality buildings. For corporate occupiers, this is less a warning sign and more a strategic instrument.
Sublease space increasingly reflects:
-
Geographic rebalancing of workforces
-
Shifts toward suburban or campus-centric hubs
-
Corporate policies redefining “downtown presence”
Importantly, these subleases often offer:
-
Turnkey or lightly used build-outs
-
Shorter or more flexible terms
-
Reduced upfront capital commitments
Sophisticated occupiers are leveraging sublease space as:
-
Interim or swing space
-
Pilot locations for new workplace strategies
-
Bridge solutions during multi-market portfolio transitions
Rather than undermining the market, sublease inventory adds optionality—particularly valuable for enterprises navigating uncertainty around headcount, policy, and growth.
The Development Pipeline Has Stopped—And That Changes The Equation
Only one office building is currently under construction in Chicago’s CBD. This is not cyclical hesitation—it is structural.
Rising construction costs, financing constraints, and rent thresholds have made speculative office development economically unviable. For corporate tenants, this introduces a subtle but important shift in leverage dynamics.
Short-term:
-
Tenants still have negotiating power
-
Landlords remain motivated to transact
-
High-quality options are available
Medium-term:
-
Replacement inventory disappears
-
Large contiguous blocks become scarce
-
Leverage tilts back toward landlords of best-in-class assets
This is why waiting for “more clarity” may prove counterproductive. By the time clarity arrives, options may not.

What Chicago Reveals About National Corporate Portfolios
Chicago is not unique—it is illustrative.
Across major U.S. markets, REoptimizer® sees the same themes emerging:
-
Demand concentrating into fewer, better buildings
-
Corporate footprints shrinking but stabilizing
-
Portfolio decisions increasingly driven at the enterprise level
-
Flexibility valued over long-term certainty
Markets with high vacancy can still offer exceptional solutions for large occupiers—if those occupiers are willing to differentiate between market weakness and asset strength.
Chicago’s scale, diversity of submarkets, and paused pipeline make it a particularly clear case study of where corporate real estate is heading.
How Fortune 500 Occupiers Should Be Thinking Now
Align Real Estate With Workforce Strategy
Office decisions should be evaluated alongside:
-
Attendance expectations
-
Talent geography
-
Cultural and brand objectives
-
Long-term flexibility needs
Real estate that does not actively support these goals becomes a liability, regardless of rent.
Focus On Optionality, Not Just Economics
The best transactions today are not always the cheapest—they are the most adaptable. Look for:
-
Expansion and contraction rights
-
Early termination options
-
Phased take-downs
-
Portfolio-wide alignment across markets
Think In Portfolios, Not Projects
Chicago decisions should ladder into broader questions:
-
Where are core hubs versus satellite locations?
-
How much permanence is truly required?
-
Which markets deserve long-term capital commitment?
Enterprises that treat each lease as a standalone decision risk misalignment at scale.

The REoptimizer® Perspective
Chicago’s office market is not broken. It is rebalancing around relevance.
For large corporate occupiers, the current moment offers:
-
Access to top-tier assets
-
Meaningful negotiating leverage
-
Strategic flexibility rarely available in stable markets
-
A chance to future-proof portfolios before supply tightens again
The companies that benefit most will not be the ones waiting for perfect certainty—but the ones using today’s imbalance to make intentional, portfolio-driven moves.
REoptimizer® partners with enterprise occupiers to align real estate decisions with workforce strategy, financial discipline, and long-term corporate objectives. Book a demo to see just how much it can empower your portfolio.
Frequently Asked Questions For Corporate Occupiers
Is now a good time for large tenants to make Chicago office decisions?
Yes—particularly for tenants seeking high-quality space with leverage and flexibility.
Should enterprises expect further rent declines?
In average buildings, possibly. In top-tier assets, pricing is stabilizing faster than headline data suggests.
Does hybrid work reduce the need for premium office space?
On the contrary, hybrid environments increase the importance of quality, efficiency, and experience.
High vacancy rates, a growing wave of landlord defaults, and a lingering oversupply of office space have created a rare market moment: corporate tenants can often secure better buildings on better terms—sometimes for less than they’d have paid years ago.
But there’s a catch. Distressed assets are a major risk and navigating this environment should not be taken lightly for tenants. To make it more difficult, they’re not waving a white flag announcing the trouble. There can be real risk hiding behind an address. This includes the landlord’s broader debt exposure, watchlist status, and cross-collateralized loans that can drag “healthy” properties down with “sick” ones.
That’s why today’s winners aren’t guessing—they’re using REoptimizer® to uncover which landlords are on a watchlist, what loans are at risk, and which properties may be tied together behind the scenes.
In this article, you’ll learn how to:
-
Define what makes a commercial property “distressed”
-
Understand why distressed buildings can be strategically valuable for tenants
-
Identify risk and opportunity using landlord watchlists and cross-collateral exposure
-
Negotiate smarter by knowing what the landlord can’t afford to lose
And while distressed properties aren’t automatically “bad,” the danger is leasing from a landlord whose portfolio-level risk can create operational, financial, and continuity headaches for your business. Let’s discuss.
What Defines a Distressed Commercial Property?
A commercial property is “distressed” when financial or operational pressure makes it undervalued, unstable, or at elevated risk of default, foreclosure, or forced restructuring. Common indicators include:
Loan Distress and Servicing Red Flags
-
Delinquencies (missed or late payments)
-
Special servicing transfers (a major warning sign that the lender has stepped in)
-
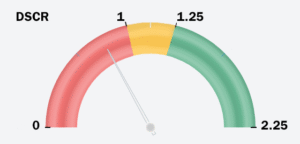
Weak DSCR (Debt Service Coverage Ratio) where income doesn’t comfortably cover debt payments
-
As a rule of thumb, DSCR below ~1.0–1.25 often signals heightened risk, depending on the lender and asset profile.
-
High Vacancy and “Silent Vacancy”
-
Vacancy rates: obvious indicator of weaker tenant demand and unstable cash flow
-
Under-occupancy (“dormant vacancy”): space that looks occupied today, but is functionally vacant the moment a lease rolls.
Market Saturation
Oversupplied submarkets create fire-sale leasing conditions—especially in older classes of inventory. Distress, in other words, isn’t just about a building. It’s about cash flow + debt + market pressure converging in a way that reduces stability and increases urgency.
How to Identify Distressed Properties (and Risky Landlords) the Smart Way
Whether you want to avoid distressed assets, audit your current portfolio, or capitalize on tenant-favorable conditions, your method matters. A quick “market scan” won’t cut it anymore.
1. Use Distress and Watchlist Intelligence (Not Just Comps)
Traditional leasing analysis is backwards-looking. Watchlist intelligence is forward-looking.
With REoptimizer®, you can evaluate a target building through the lens that matters most:
-
Is the landlord on a watchlist?
-
Is the loan associated with the property showing elevated risk signals?
-
Are there other properties in the owner’s portfolio that appear connected (cross-collateralized) to loans under stress?
This is how corporate tenants avoid signing a long-term lease under a landlord who may be forced into reactive decision-making.

2. Leverage CMBS and Loan-Performance Data for Negotiation Power
Platforms like Trepp and KBRA aggregate CMBS and credit performance data that can help identify pressure points. Key metrics to watch include:
-
Special servicing and delinquency flags
-
High LTV (Loan-to-Value): often signals thin equity and urgency to stabilize cash flow
-
Debt yield weakness: low debt yield indicates lenders may view the loan as higher risk
-
NOI declines and cap rate pressure: signals reduced income stability
Even if you don’t live in these datasets day-to-day, REoptimizer®’s watchlist visibility helps translate “credit stress” into real-world leasing decision support.
3. Track Market Indicators (At the Submarket Level)
Big headline vacancy numbers don’t negotiate your lease—micro conditions do.
Look at:
-
Vacancy by class (A vs. B/C)
-
Vacancy composition (shadow vacancy, near-term rollovers)
-
Net absorption trends by submarket, not just city-wide averages
-
Employer movement patterns and infrastructure investment
The best opportunities often sit in the gaps—where a submarket is weak overall, but a specific pocket is still strategically valuable.

Risks When Leasing a Distressed Building
The biggest risk is not the space—it’s the landlord’s financial position and what’s happening across their portfolio.
Key tenant risks:
-
Service degradation (maintenance delays, understaffed management)
-
Deferred capex (systems fail, upgrades stall)
-
Ownership disruption (sale, receivership, lender control)
-
Lease administration issues during restructures
Most importantly: a building that looks “fine” can still be risky if the owner is exposed elsewhere.
Why Distressed Properties Can Be a Strategic Advantage (If You Avoid the Wrong Risks)
Distressed office environments are brutal for landlords and lenders—but that stress can translate into meaningful tenant upside:
Cost Savings and Concessions
Distressed owners are often more willing to offer:
-
Lower base rent
-
Bigger TI (tenant improvement) allowances
-
Longer rent-free periods
-
Flexibility on term length, options, signage, etc.
Better Space for the Same (Or Less) Money
This is where tenants can “trade up” into stronger locations or higher-class assets at reduced effective rates—boosting brand perception and talent attraction.
Negotiating Leverage
A landlord under pressure values predictable cash flow. A strong corporate lease can be the difference between stabilizing the asset—or sliding further toward default.
But here’s the part most tenants miss:
What Lease Protections Should Tenants Request in Distressed Situations?
If a property or owner shows financial stress, tenants should prioritize operational continuity and risk containment, not just pricing. High-value protections to negotiate:
-
Stronger landlord maintenance/service obligations
-
Clear remedies and cure periods
-
Delivery and TI completion guarantees
-
Operating expense transparency / caps (where feasible)
-
Rights tied to building disruption events (practical protections if conditions deteriorate)

The Hidden Risk: A “Fine” Building Owned by a Watchlisted Landlord
Even if your building looks safe, the owner’s portfolio may not be.
Landlords frequently use financing structures that can connect multiple properties to the same debt obligation. In cross-collateralized loans, several properties serve as collateral for a single loan (or interconnected loans). If one asset deteriorates, it can raise risk across all linked assets—even the ones performing well.
That can create tenant risks like:
-
Deferred maintenance or degraded building services
-
Slower response times from ownership/management
-
Surprise ownership changes or lender intervention
-
Disrupted capital plans (elevators, HVAC, lobby, build-out approvals)
-
Lease administration complications during restructures
Where REoptimizer® Changes the Game
Instead of relying on surface-level deal comps and a building tour, REoptimizer® helps tenants:
-
See which landlords are on a watchlist
-
Identify which properties appear tied to debt at risk of default
-
Spot potential cross-collateral exposure so you can avoid getting trapped in a portfolio-wide problem
This means you can pursue “distressed opportunity” while filtering out “distressed operator risk.”
How to Approach Negotiations Once You’ve Found a Target
When REoptimizer® shows ownership pressure (watchlist status, risky debt, portfolio flags), you don’t just “ask for a better deal.” You negotiate around what the landlord must solve.
High-impact asks commonly include:
-
Larger TI allowances (or turnkey build-outs)
-
Longer free rent and phased commencement
-
Stronger landlord work-letter commitments
-
More protective defaults/cure rights
-
Expanded termination/relocation rights (where appropriate)
-
Audit rights / transparency improvements in operating costs
Knowing the landlord’s risk profile helps you structure terms that protect your operations—not just your rent number.

Bottom Line: Distressed Can Be a Win—If You Can See the Landlord Risk
Distressed leasing environments create real opportunity for corporate tenants. But the smartest move isn’t simply finding a “cheap Class A building.”
It’s finding the right building owned by the right landlord, with a clear view into:
-
watchlist risk,
-
loan stress,
-
and cross-collateral exposure that could blindside you mid-lease.
That’s exactly what REoptimizer® is built for: turning opaque landlord risk into actionable intelligence—so your relocation is an advantage, not a gamble. Learn more about how to utilize REoptimizer® for portfolio wide visibility and strategic moves that will keep your portfolio safe for years to come.
Miami’s industrial market has spent the last several years reshaping itself into one of the most competitive logistics environments in the United States — not through hype, but through consistent performance. Since 2020, the region has demonstrated a steady combination of rent growth, tightening vacancy, and durable demand across nearly every major submarket. Q3 2025 continues that pattern, and for large corporate occupiers, the signal is clear: Miami requires a more strategic, data-driven approach to footprint planning.
Below, we break down the trends that matter most for decision-makers — and what they mean for tenant strategies going forward.

Rents Continue Rising — And Not by Accident
Q3 2025 marked the fifth consecutive quarter of rental growth, with average direct asking rents reaching $17.59 psf NNN, up 21 basis points from Q2. That might not sound dramatic, but in the industrial world, five straight quarters of increases is meaningful. It illustrates a market that is neither cooling nor plateauing; instead, it’s demonstrating resilience even as deliveries continue.
What’s more striking is the rent bifurcation that has been building since 2020. Core submarkets such as Airport West, Medley, and Kendall command $9–$11 psf premiums over their 2020 rents. The report’s submarket comparison shows:
-
Kendall at $22.04 psf
-
Central Dade at $22.71 psf
-
Airport West at $19.58 psf
-
Meanwhile, relatively more affordable pockets like Hialeah remain at $14.63 psf
For occupiers, the takeaway is not simply that rents are high. It’s that Miami’s pricing structure has become more stratified, making location decisions more financially consequential. Choosing the right submarket can translate to millions in occupancy cost differences over a multi-year term.
Vacancy Remains Low Enough to Give Landlords Confidence
Market-wide vacancy landed at 5.8%, with direct vacancy at 5.5% and sublet space at just 0.3%. Sublet availability often serves as a pressure-release valve in tight markets; here, that valve is barely cracked open.

Vacancy by submarket tells an even clearer story:
-
Kendall: 1.4%
-
Hialeah: 3.1%
-
South Dade: 3.4%
-
Northeast Dade: 6.9%
-
Northwest Dade: 8.3% (highest in the region)
Even the submarkets with higher vacancy are not “soft” by national standards. Everything sits firmly within what analysts would categorize as landlord-favorable conditions.
For corporate occupiers, this means fewer options, shorter decision timelines, and a leasing environment where competing tenants often circle the same viable spaces. If your organization values optionality, Miami will challenge that preference.
Absorption Rebounds, Signaling Renewed Demand
One of the most important Q3 metrics is the rebound in demand. Net absorption reached 670,459 square feet, more than doubling Q2’s total. This is not a spike driven by one outsized deal; it reflects a broad re-engagement from tenants across diverse sectors.
Notable transactions from the quarter include:
-
The American Bottling Co. – 150,600 sf
-
Amcar Freight – 126,101 sf
-
United States Postal Service – 86,867 sf
-
Vista Color Corp – 75,000 sf (renewal)
These deals span manufacturing, logistics, freight, and service providers — a healthy sign that the demand base is diversified rather than dependent on one driver.
This level of absorption, combined with low vacancy, suggests that Miami’s market position is not cyclical noise; it’s structural.

New Construction Is Active — But Still Not Loosening the Market
Year-to-date deliveries total 2.2 million square feet, and another 3.8 million square feet are under construction. That’s a substantial pipeline for a geographically constrained region.
However, current data shows that ongoing deliveries aren’t easing fundamentals:
-
Vacancy decreased 20 bps quarter-over-quarter
-
Rents increased for the fifth straight quarter
-
Absorption absorbed supply without a rise in available space
In short: supply is coming, but demand is keeping pace. And because Miami’s development capacity is limited by land availability, this pattern is unlikely to change materially in the near term.
Some Submarkets Are Tightening Faster Than Others
Drilling into the submarket data reveals important patterns for occupiers evaluating site selection:
1. Kendall & Central Dade: Highest Rents + Lowest Availability
With rents above $22 psf and vacancy between 1.4% and 5.6%, these infill submarkets offer operational advantages (population density, proximity to consumption), but at a cost. Expect minimal concessions and a very limited inventory of modern product.
2. Hialeah & Northeast Dade: Value Submarkets Gaining Momentum
Hialeah’s 3.1% vacancy and $14.63 psf rent make it a relative bargain. Northeast Dade, at $15.70 psf, showed notable absorption as well. These submarkets may become increasingly competitive if pricing in northwest and central areas continues climbing.
3. Northwest Dade: More Availability, Still Rising Rents
With the highest vacancy (8.3%), Northwest Dade offers more immediate options, but rents remain elevated at $16.31 psf. As newly delivered product comes online, this may become the “value with breathing room” submarket for large-scale occupiers.
4. Airport West & Medley: Core Logistics Hubs Stay in Demand
Airport West alone has 61.9 million square feet of existing inventory and 2.4 million square feet under development. These locations remain the heartbeat of Miami’s distribution network. Rents remain elevated but justified by access advantages.
For executives managing multi-site footprints, submarket positioning is a core strategic variable.

Investment Activity Reinforces Long-Term Stability
One of the clearest indicators of Miami’s sustained strength is investor behavior. In Q3:
-
Miami led Florida with $687M in industrial sales
-
Average pricing achieved $276 psf — the highest in the state
-
Major institutional investors like Terreno Realty and Link Logistics remained active buyers
This sets an important tone: institutions are pricing Miami as a premium industrial market — and their underwriting assumptions typically reflect long-term rent growth and low structural vacancy.
For occupiers, institutional ownership has two implications:
-
Lease negotiations become more standardized and more formal
Large owners tend to keep tight ranges on concessions, term flexibility, and TI allowances. -
Operating expenses may increase
Enhanced asset management, capital improvements, and stricter maintenance schedules typically follow institutional acquisition.
Neither of these is inherently negative. But they require occupiers to forecast total occupancy costs — not just base rent — more rigorously.
What This Means for Corporate Occupiers
Based on Q3 performance and broader market patterns, Miami demands a more proactive, more analytical approach. The strategies that worked five years ago are unlikely to perform well today.
Here’s what large tenants need to prioritize:
1. Start Renewals Earlier and Model Multiple Scenarios
Given 5.8% vacancy and minimal sublet availability, waiting to approach a renewal until the final 12 months of a lease is risky. Early engagement allows:
-
Cost modeling across multiple submarkets
-
Exploration of off-market options
-
Better positioning against competing tenants
Miami is a market where optionality shrinks quickly.
2. Run a Submarket-Level Cost-of-Operations Analysis
The report’s rent disparities can materially impact:
-
Transportation and labor costs
-
Delivery times
-
Inventory positioning
-
Customer proximity
-
Workforce access
A location at $14.63 psf vs. $22.71 psf isn’t just a rent difference — it’s a supply chain design choice.
3. Evaluate New Construction Early — Not Late
With 3.8 million square feet in the pipeline, Class A options exist or will exist soon. But many of these:
-
Deliver with pre-leasing already in place
-
Lease ahead of shell completion
-
Come at a premium but provide operational advantages (clear heights, loading ratios, energy efficiency)
The companies evaluating new builds now will have the first pick of suitable layouts.

4. Leverage Multi-Market Strategy to Optimize Miami Exposure
If high rents in core Miami aren’t essential to operations, consider:
-
Hybrid strategies (bulk storage outside Miami + last-mile inside Miami)
-
Shift of non-time-sensitive operations into value submarkets
-
Shorter terms in constrained areas to maintain agility
Miami’s density and growth make it a high-value node, but not every function needs to sit within the highest-cost zones.
5. Strengthen Data-Driven Portfolio Planning
With rents having risen for five consecutive quarters and core submarkets holding price premiums since 2020, occupiers should:
-
Model future rent escalations
-
Analyze occupancy cost inflation
-
Use scenario planning for long-term commitments
Cost predictability is becoming harder — and therefore more essential.
Positioning for the Next Phase of Miami’s Industrial Evolution
Miami’s industrial market is not defined by volatility or dramatic swings. Instead, Q3 2025 affirms a pattern of steady, durable, and broad-based strength. The region continues to cement its place as Florida’s premier logistics hub, supported by land constraints, diversified demand, and sustained investor confidence.
For corporate tenants, the opportunity lies in adapting early. Those who treat Miami simply as “another logistics node” will pay a premium for it. Those who treat Miami as a strategic, data-intensive occupancy challenge will unlock better—often significantly better—long-term outcomes.
The industrial market is evolving. Tenant strategy needs to evolve with it.This is where intelligence becomes a differentiator.
REoptimizer® gives occupiers the visibility, modeling power, and comparative insight needed to navigate Miami’s evolving landscape (while mapping comparisons to other markets) with intention rather than reaction. If the next phase of your strategy requires clearer decisions, stronger leverage, and fewer surprises, this is the platform built to deliver it. Learn more how this tool can give your portfolio the razor sharp edge it needs.
For the better part of a decade, industrial real estate has been defined by scale: million-square-foot behemoths, towering clear heights, and enough trailer parking to serve a small country. Corporate occupiers, retailers, logistics operators, and manufacturing giants all raced to build or lease the next large bulk distribution property in their supply chain.
But as economic cycles shift, consumer behavior evolves, and costs continue northward, a new workhorse asset class is stealing the spotlight—small-bay industrial.
Once dismissed as an unglamorous corner of the industrial sector—filled with HVAC contractors, micro-manufacturers and niche distributors—small bay industrial spaces have quietly become one of the most competitive, supply-constrained and strategically important components of modern logistics and operations planning. And now, national tenants, portfolio operators, and sophisticated corporate real estate teams are paying attention.
The question for corporate occupiers is no longer Why would we consider a small bay industrial property? It’s now How fast can we secure one before someone else does?
Let’s break down the data, the market trends, and most importantly, what large-scale occupiers need to understand as this asset class reshapes the industrial landscape.

Small Bay Is Outperforming Other Industrial Spaces
Across the U.S. industrial market, the story is remarkably consistent:
- Vacancy for small bay industrial spaces is just ~4.2%, compared to 7.4% for large properties.
- Rents for small bay industrial buildings have surged over 40% since 2020—outpacing most other forms of industrial real estate.
- In Q2 2025, 62% of all industrial sales under $25M were small-bay properties, totaling nearly $5.9B.
- Average sale prices have climbed 55% since 2020, reaching $104/SF.
After many years of “bigger is better,” the industrial sector has flipped its script. Today, smaller industrial spaces are commanding higher demand, stronger rent growth opportunities, and more investor attention than large bulk facilities.
Why? Because small bay industrial is structurally under-supplied—and tenants from nearly every industry segment have realized these buildings solve problems that large boxes simply can’t.
Why Commercial Real Estate Has Room for Small Spaces
Small bay industrial properties, typically 2,000 to 50,000 square feet (sometimes up to 150K SF depending on the market), bring a different value proposition—one that aligns tightly with modern operating pressures:
1. Strategic Infill Locations
Small bay industrial buildings are disproportionately located in dense, infill markets—where land is scarce, entitlement is arduous, and consumers live.
They offer:
- Easy access to city centers
- Shorter distances to customers
- Faster last-mile delivery
- Better connectivity for technicians, service providers, and field ops teams
These locations are also where new development rarely pencils—because replacement costs, zoning restrictions, and competition with residential or mixed-use projects make land prohibitively expensive.
This limited supply is exactly why property values and market rents are climbing so aggressively.

2. A Larger, More Diverse Tenant Base
Corporate tenants aren’t just competing with other large companies for these buildings—they’re competing with:
- Small businesses
- Local contractors
- Micro-fulfillment operators
- E-commerce brands
- Specialty manufacturers
- “Fabric of society” users—everything from millwork shops to batting cages
This diverse tenant base gives property owners pricing power, shorter WALT (weighted average lease term), and the ability to reprice rents frequently. For corporate tenants, it means competition is fierce—even for spaces that would’ve been considered “too small” five years ago.
3. Shorter Lease Terms = More Agility (and More Rent Increases)
While long-term leases provide stability for large bulk distribution properties, they can feel like handcuffs in volatile markets.
Small bay industrial spaces generally offer:
- 3-5 year lease terms, not 10-15
- More flexible expansion/contraction opportunities
- Lower absolute rent obligations
- Less risk exposure
That flexibility is appealing to corporate occupiers navigating rapid operational changes—but it also means frequent repricing, which supports landlords and gives them inflation protection.

4. Operational Efficiency
Many businesses have realized they don’t need—and often can’t effectively use—a million-square-foot warehouse. Small bay facilities offer:
- Right-sized footprints
- Lower energy and facility costs
- Faster occupancy build-outs
- “Close-to-customer” functionality
In an economy where margins are thin and speed is a competitive advantage, the right 10,000 SF in the right location can outperform a giant box 40 miles outside town.
The Supply Problem in the Industrial Sector
Here’s where things get tricky: Everyone wants small bay—but almost no one is building it.
Developers say new supply doesn’t pencil without rent levels that tenants simply won’t pay. Why?
- Construction costs for small buildings are higher per square foot.
- Land prices in infill locations are inflated and better suited for multifamily or retail.
- Municipal requirements (parking, landscaping, stormwater management) scale poorly with smaller footprints.
- Higher interest rates have made underwriting new development even tougher.
- And the walls—literally—cost more. Smaller rectangles require more perimeter walling relative to floor area.
Even when developers turn to cost-saving options like preengineered metal walls, the savings are often negligible unless the building shape is perfectly optimized. Investors dislike metal walls anyway because they trade at lower yields on exit.
The result? New development is nearly nonexistent, outside of:
- build-to-suit projects for users who can afford to control their real estate
- speculative flex parks on discounted land
- “friends and family” projects where local capital keeps costs manageable
This supply constraint is why small bay rents keep rising—even in markets with flat or declining big box rents.
Regional Hotspots: Where Demand Is Surging the Fastest
While small bay industrial demand is national, certain markets are experiencing explosive pressure:
West
- Phoenix East Valley
- Reno
- Boise
Drivers: affordability, population growth, proximity to West Coast consumers.
Midwest
- Grand Rapids
- Columbus
- Chicago suburbs
Drivers: manufacturing resurgence, reshoring, diversified local industries.
Southeast
- Central Florida
- Nashville
- Atlanta
Drivers: population inflows, logistics demand, rents up to 100% in some areas.

Northeast / Mid-Atlantic
- Lehigh Valley
- South Jersey
- NYC outer boroughs
Drivers: severe infill constraints, dominant last-mile demand, micro-industrial parks.
In markets like Philadelphia, shallow-bay rents are up ~9% year over year—faster than Chicago, Atlanta, and Dallas, according to CompStak.
But even with strong rent increases, the premium over large industrial properties in Philly remains just 7%, compared to 21% in other metro areas—showing how underpriced the segment still is.
Why Investors Are Buying Everything in Sight
Investors—private equity, REITs, international capital, and local owner-operators—have discovered what tenants know all too well: small bay industrial is operationally sticky and extremely difficult to replace.
They like this segment because it provides:
- High renewal probabilities
- Sticky tenants (moving is expensive for small businesses)
- Shorter leases = constant mark-to-market opportunities
- A compelling investment thesis amid inflation
Cap rates on stabilized assets are in the mid-6% range, with value-add targeting 7–8% yields on cost—very attractive relative to other commercial real estate categories.
Many investors are pursuing aggregation strategies: buying older 1970s–1990s light industrial buildings, upgrading them (lighting, loading docks, office refreshes), and bundling portfolios for institutional sale.
If it feels like every small bay facility in your market has suddenly been repainted and is asking $2/SF more than last year… that’s why.
What Corporate Tenants Need to Know (Before the Space Is Gone)
1. Start Early—and Move Quickly
Small bay industrial spaces lease fast. Very fast.
If you’re used to evaluating 500K-SF options over several months, the small bay market will feel like speed dating: If you wait, someone else will sign—often a small business willing to pay more.
2. Expect Higher Rents (and Faster Increases)
Market rents are rising sharply, and asking rents often lag behind.
Tenants should expect:
- Multiple rent increases during a single business cycle
- Stronger landlord leverage
- Higher renewal rates
- Limited concessions
Shorter leases are great for flexibility—but they also mean more exposure to repricing.
3. Think Multi-Site, Not Mega-Site
One large facility may no longer be the answer.
Corporate occupiers are increasingly:
- Creating satellite networks
- Mixing mid-bay and small-bay locations
- Using smaller spaces to handle overflow, field teams, and same-day distribution
- Bringing inventory closer to customer clusters
It’s the industrial version of “hub and spoke”—and it works.
4. Understand the Replacement-Cost Problem
Even if a building looks outdated, it might be the best option available—because it cannot be replicated today.
Replacement cost often exceeds market rents by 20–40%—if zoning even allows a new build.
This makes older small-bay inventory functionally irreplaceable.
5. Get Creative With Space Needs
If your requirement is exactly 30,000 SF with 24’ clear, 3 docks, and heavy power… congratulations, you and 200 other tenants are looking for the same thing.
The companies that win in this segment:
- Stay flexible
- Consider slight modifications
- Accept older features when necessary
- Prioritize location over perfect specs
You can upgrade lighting. You cannot relocate a building five miles closer to customers.

6. Small Bay Requires Active Management—But Offers Big Benefits
These spaces often involve:
- Frequent lease rollover
- More operational touchpoints
- Greater coordination with contractors and vendors
But they give companies:
- Agility
- Proximity to customers
- Lower occupancy costs
- Better resilience across economic cycles
It’s a tradeoff—but one that increasingly works in tenants’ favor.
Small Bay Isn’t “Small” Anymore; It’s Strategic
Small bay industrial is no longer the forgotten side of the industrial market. It’s a growing segment, a supply-constrained asset class, and a critical tool for businesses navigating rapid change.
The combination of:
- limited new supply
- consistent demand
- shorter lease terms
- inflation protection
- diverse users
- and strategic infill locations
…has created a market where the smallest spaces now carry the biggest competitive edge.
For corporate real estate teams and C-suite leaders, the era of “mega-warehouse only” strategies is over. The future supply chain is distributed, flexible, and built around proximity—not size.
The U.S. office market is still in reset mode. As of September 2025, the national office vacancy rate sat at 18.6% (down 80 bps year-over-year) and the average listing rate hovered around $32.79/SF.
That’s the backdrop—but picking markets this year isn’t about quoting a national average or chasing the shiniest trophy towers. It’s about finding metros where vacancy is manageable, rents are defensible, and the supply pipeline won’t swamp demand.
So, instead of declaring every big-name city a “top market,” we ranked places on five practical levers:
- Vacancy relative to the national average
- Asking rents and whether tenants are actually paying them
- Sales volume/price per square foot (a proxy for capital confidence)
- New supply risk (projects under construction now, not hypotheticals)
- Narrative risk (sublease overhang, remote-work stickiness, CBD health, safety)
With that in mind, here’s where the numbers point in 2025.
Tier 1: “Lean In” Office Markets
These markets pair healthier vacancy rates with pricing power and pipelines that look digestible. They’re not risk-free—but they’re the closest thing to durable.
Miami
Miami’s story is straightforward: tight vacancy (~12.8%), rising rents ($56.45/SF), and a pipeline that’s meaningful (~1.6M SF) without being reckless. Finance, tech, and professional & business services continue to backfill demand—often for new office space with the amenities that pull people in a few days each week.
Why it works: Miami has pricing power and activity. You don’t see a lot of empty office space, and concessions haven’t blown out. For tenants, that means less “fire sale” pricing—but better building quality. For owners, there’s enough demand depth to keep the lights bright.
Manhattan (NYC)
Yes, costs are high ($66.27/SF, the national peak). But the data shows vacancy around 12.8%—tied for tightest—and a $5.5B YTD sales figure that keeps New York No. 1 for liquidity. About 3.0M SF is under construction, which is sizable, but scaled to a massive base.
Why it works: Flight-to-quality is real. Top-tier office space is getting leased; commodity assets need a plan. If you’re a tenant, you can upgrade into better buildings and lock in terms that would’ve been unthinkable in 2019. If you’re an owner, outcomes diverge: A/A+ product wins; older B space needs repositioning or pricing surgery.
Boston
Vacancy ~15.4% and rents ~$43.67/SF, with the nation’s largest pipeline (~4.45M SF). On paper, that pipeline looks scary. In practice, Boston’s demand engine—life sciences, tech, and education—keeps absorbing office inventory when the product is truly best-in-class.

Why it works (with discipline): New supply will favor new buildings. If you’re not competitive on specs, location, or amenities, you’ll feel it. If you are, Boston still rewards quality.
Tier 2: “Proceed, But Pick Your Office Buildings Carefully”
These metros are attractive—but require sharper submarket and asset selection.
Washington, D.C.
Vacancy ~20%, rents ~$40.83/SF, and $3.2B YTD sales—third nationally. The tenant base (federal + legal/associations) is sticky, but commodity space can linger.
Playbook: Focus on amenitized, well-located A/A+ buildings; reposition or price B product realistically. D.C. still trades—and that matters for owners and lenders.
Dallas–Fort Worth
Vacancy ~22.2% and one of the country’s biggest pipelines (~2.62M SF). Rents around $32.40/SF keep DFW competitive for large corporations and small businesses alike.
Playbook: Favor proven nodes (Uptown-adjacent, mixed-use corridors) where net absorption is tangible. Watch excess supply in fringe submarkets.
Los Angeles
Vacancy ~15%, rents ~$41.11/SF, $2.04B YTD sales. LA is a “city of submarkets”—Westside media corridors can hum while other pockets tread water.
Playbook: Stick to walkable, mixed-use areas with transit and services; central business district performance is more uneven.
Phoenix
Vacancy ~17.6% (better than national) and rents ~$29.41/SF (affordable). With ~1.14M SF under construction, pipeline risk is present but not overwhelming.
Playbook: A value market where tenants can step up in quality. Owners benefit from modest supply and in-migration tailwinds—provided the assets are modern and flexible.
Twin Cities (Minneapolis–St. Paul)
Vacancy ~17.8%, rents ~$26.96/SF, and a small pipeline (~0.60M SF).
Playbook: Quietly constructive. Limited new construction supports occupancy; value-oriented tenants can land quality space without sticker shock.
Tier 3: “On the Bubble”
The numbers can work—but timing and asset selection matter even more.
- Charlotte: Vacancy ~19.3% and rents ~$35.57/SF with banking/finance demand. Good momentum, but rising vacancy means discipline.
- Nashville: Vacancy ~19.5%, up 220 bps YoY, after a construction boom. The good news: the pipeline has tapered (<300k SF under construction), finally giving the market time to absorb excess supply.
- Chicago: Vacancy ~18.9%, rents ~$28.15/SF. Big and liquid, but bifurcated. Trophy office near transit and amenities holds up; commodity CBD space needs reinvestment.
Let’s Be Blunt: High Rents ≠ “Top Market”
San Francisco (and the broader Bay Area)
Rents are high (SF $64.17/SF; Bay Area $51.77/SF), but vacancy is higher (~26.7% in San Francisco; ~23.8% across the Bay Area). Yes, certain trophy office assets trade and lease; yes, select submarkets are resilient. But at the market level, there’s too much empty office space and a persistent sublease overhang.
Call it what it is: a selective, asset-by-asset opportunity—not a “top office market” in 2025.
Seattle
Vacancy ~27%—the West’s high. Investment pricing (~$258/SF) can still be strong for fully leased, modern assets with big-tech credit. That’s the barbell: excellence wins, average struggles.
Translation: Great if your mandate is very specific; otherwise, proceed with caution.
Austin & Denver
Austin vacancy ~27% with ~2.38M SF under construction; Denver vacancy ~23.5%. Long-term demand stories are intact, but near-term vacancy rates and pipeline math argue for patience. Wait for net absorption to catch up.

Detroit & Portland
Affordability ($21.71/SF and $28.85/SF, respectively) doesn’t cancel out higher vacancy (23.8% and 21.3%). Without stronger office-using employment growth, these remain selective.
What to Do with This (Occupiers & Owners)
The point of ranking markets is to make decisions easier, not louder.
If you’re a tenant (occupier):
Use the market’s vacancy rate to set your negotiation posture, then shop building quality, not just price per square foot. In Tier-1 cities, be decisive—good office spaces move. In Tier-2/3, push for flexibility: termination options, expansion/contraction rights, TI dollars tied to creating collaborative meeting space that actually gets used.
If you’re an owner/investor:
Play the flight-to-quality. Double down on A/A+ and mixed-use ecosystems where people want to be. Where you hold B assets, your choices are reposition (wellness, hospitality-grade services, sustainability) or reprice. And keep one eye on the supply pipeline—competing deliveries are the silent killer of pro formas.
Quick Scoreboard (September 2025 snapshot)
- Tightest vacancy: Miami ~12.8%, Manhattan ~12.8%
- Highest asking rents: Manhattan ~$66/SF, San Francisco ~$64/SF (note: high rent ≠ healthy market)
- Most active capital markets: Manhattan ~$5.5B YTD, Bay Area ~$4.3B, Washington, D.C. ~$3.2B
- Largest pipelines: Boston ~4.45M SF, Manhattan ~2.96M SF, Dallas ~2.62M SF
- Highest vacancies (major markets): Seattle ~27%, Austin ~27%, San Francisco ~26.7%
Bottom Line for Commercial Real Estate
If “top” means durable performance, the shortlist in 2025 is Miami, Manhattan, and Boston—each for different reasons, all grounded in vacancy, rent integrity, and pipeline math. D.C., Dallas, LA, Phoenix, and the Twin Cities are viable with submarket precision.
And yes—San Francisco (and parts of Seattle, Austin, Denver) are not top markets right now. They’re selective plays until total square feet vacant comes down and net absorption tells a different story.
Understanding where to lease, build, or invest isn’t just about vacancy rates—it’s about reading the full picture:
Who’s growing? What’s being built? Where will the next wave of demand actually land?
REoptimizer® helps corporate real estate teams answer those questions before signing their next lease. Compare office markets by rent, utilization, and performance, and model how your footprint could perform across cities with very different cost structures and vacancy dynamics. It’s portfolio optimization, powered by real data—not guesswork.
And if vacancy rates tell part of the story, CRESiteIQ™ reveals the rest. Powered by more than 200 data points across demographics, employment, and market performance, it helps you identify where demand is growing, not just where space is available.
Pinpoint metros with sustainable momentum, evaluate markets side-by-side, and uncover the trends shaping office market resilience before the headlines do.
Make your next market move with clarity. Learn more about CRESiteIQ™.
Learn More
Commercial real estate isn’t getting simpler.
Portfolios that once fit neatly into a spreadsheet now stretch across hundreds of locations, multiple jurisdictions, and billions in commitments. And to make the pressure more intense, CRE itself is in the midst of a massive re-calibration. As commercial mortgage-backed securities (CMBS) stress tests the market, real estate leaders are realizing that lease data and debt data can’t live in separate silos. Tracking landlord risk is now essential to sound portfolio strategy.
In this environment, manual tracking is not just a risk, it’s a multi-million dollar accident waiting to happen. Missed renewals, inaccurate rent payments, and scattered lease documents can quietly drain millions in value.
That’s where lease management software like REoptimizer® reshapes the equation. By centralizing lease data, automating key dates, and surfacing real-time insights, REoptimizer® helps real estate and finance teams move from reactive administration to proactive, portfolio-wide strategy.
Because other systems tell you what you owe, REoptimizer® goes beyond and tells you what you should be paying.

Centralizing Lease Data for Complete Visibility
At its core, REoptimizer® acts as a centralized platform for all lease information—from lease agreements and lease terms to rent escalations and financial reporting.
Instead of juggling multiple tools, users can centralize lease data, track key dates, and generate custom reports from a single dashboard. This streamlined process reduces human error, enhances operational efficiency, and ensures compliance.
Beyond centralizing lease data, REoptimizer® exposes the hidden economics of space. Its utilization tracking lets teams see exactly how each property is performing — and how much capital is quietly being burned on underused square footage. Whether it’s an office operating at 40% occupancy or a warehouse paying premium rent for idle space, REoptimizer® surfaces inefficiencies that traditional systems overlook.
Portfolio leaders can benchmark sites by cost per occupied square foot, compare utilization across markets, and flag assets where spend and productivity are out of sync.

Managing the Entire Lease Lifecycle
Beyond tracking, REoptimizer® manages the entire lease lifecycle—from signing agreements and monitoring renewals to managing rent reviews and lease liabilities. Its structure supports both real estate leases and equipment leases, giving portfolio managers a complete operational picture.
By automating repetitive administrative work, REoptimizer® lets teams focus on what matters: optimizing space, managing risk, and finding opportunities for cost savings and performance gains.
Advanced Automation and AI-Powered Insights
What truly sets REoptimizer® apart is its integration of AI-powered automation. Through its AI Integration module, users can query their portfolio in plain language The system instantly produces custom reports, actionable insights, and predictive analytics—helping finance teams identify cost savings, mitigate risks, and make data-backed decisions.

The simple user interface ensures that even non-technical users can navigate complex data easily.
Beyond Lease Management: Real Estate Intelligence
Unlike traditional property management software, REoptimizer® extends into strategic real estate decision-making and site selection.
Its CRESiteIQ™ tool brings over 200 market variables—income levels, demographics, workforce data—into one dashboard. And users can layer multiple data views on an interactive map — overlaying lease data, demographics, market rents to uncover ideal site selection that static reports can’t show.
With CRESiteIQ™, portfolio leaders and tenants alike can:
- Define their Key Site Drivers (KSDs) to quantify what “ideal” really means for their business.
- Compare how existing and prospective properties stack up against those drivers and perform open market rent reviews
- Visualize trade-offs between cost, location, and talent access across multiple markets.
- Instantly surface hidden gems — properties that perfectly match your profile but fall just beyond your usual search radius.
- Manage the entire site-selection process from one platform — from shortlisting to lease negotiation.
CRESiteIQ™ helps you see the story your data is trying to tell. Instead of just showing you where your leases are, it helps you understand where your opportunities could be. You can zoom out to see macro-level portfolio trends or zoom in to explore submarkets that align with your KSDs and tenant priorities.
Executives explore “what-if” scenarios that used to take weeks of analysis.This makes REoptimizer® not just lease administration software, but an all-in-one property management and location intelligence solution that supports portfolio optimization across multiple locations.
Key Features that Define the Best Lease Management Software
REoptimizer® exemplifies what modern organizations expect from the best lease management software:
- Centralized Data – Combine all lease documents, key dates, and financials in one secure database.
- Automated Alerts & Reminders – Get notified of critical dates like lease renewals, expirations, and rent reviews.
- Custom Reports & Dashboards – Generate custom reports tailored for executives, finance teams, and auditors.
- Audit Trails & Compliance – Maintain detailed audit trails for lease accounting and regulatory compliance.
- Actionable Insights – Use AI to identify operational efficiency gains and cost savings opportunities.
- User-Friendly Interface – A simple user interface ensures rapid adoption and minimal training.
- Enterprise-Grade Security – Protects centralized data and ensures confidentiality for property owners and tenants alike.
Real-World Results and Data-Driven Outcomes
The platform’s results speak volumes. Companies like Coca-Cola, eGifter, and Gentian CFO Partners have publicly cited improvements in lease administration, cost control, and data transparency:
- Coca-Cola’s CRE team leveraged REoptimizer® to benchmark lease terms and market rents, improving renegotiation leverage and saving six-figure sums annually.
- eGifter’s CFO reported measurable reductions in overhead through automated reminders and critical date tracking.
- Gentian CFO Partners used the system’s analytics to monitor key events and assess financial reporting across diverse portfolios.
Enhancing Collaboration Across Teams
A strong lease management platform doesn’t just centralizing data while ensuring it’s accessible across multiple departments.
With REoptimizer®, property managers, finance teams, and executives can all operate from the same data source. This reduces human error, improves transparency, and allows teams to track key dates and lease payments in real time.
Its document management capabilities ensure that lease agreements, payment schedules, and rental history are securely stored, searchable, and audit-ready. Built-in automated alerts keep everyone informed of key events and missed renewals, so organizations can act proactively rather than reactively.
Integrations That Extend Value
REoptimizer® connects seamlessly across your real estate workflows, creating a centralized platform for financial reporting, lease tracking, and portfolio analysis. Users can generate customizable reports, extract key lease data, and export insights for finance or operations teams—reducing duplicate data entry and improving operational efficiency.
Its design supports seamless data connections and real-time insights, helping organizations make smarter, faster decisions without disrupting existing systems
The Role of Lease Management Software in Modern Real Estate
The modern leasing process has evolved into a data-rich, analytics-driven discipline. Lease administration platforms like REoptimizer® play a pivotal role in transforming real estate leases from static contracts into living assets that drive value. By combining lease tracking, custom reports, and advanced automation, organizations gain the power to make smarter, faster, more strategic decisions.

Furthermore, as sustainability and hybrid work reshape space needs, REoptimizer®’s actionable insights help portfolio leaders anticipate changes, identify rent-free periods, and rebalance their lease portfolio in real time.
How REoptimizer® Redefines “Best Lease Management Software”
While many tools claim to simplify lease administration, few deliver end-to-end intelligence. REoptimizer® distinguishes itself by blending lease management, property management, and real estate analytics into a unified ecosystem. Its AI-driven architecture converts raw lease data into actionable insights, enabling teams to:
- Forecast rent escalations and rent reviews before they impact budgets
- Identify underperforming locations using custom reports
- Scan their lease portfolio for landlords on a watchlist for default.
- Align financial reporting with real-time market trends
This convergence of automation and intelligence defines why REoptimizer® stands among the best lease management software platforms in today’s market. Because with layered analytics and cross-portfolio visibility, teams can spot red-flag properties early—such as those tied to at-risk or cross-collateralized landlords—and take proactive steps before exposure turns into loss.
Conclusion: Smarter Real Estate Starts with Smarter Data
In the modern CRE landscape, managing lease payments and tracking key dates is just the beginning. True efficiency requires visibility, automation, and intelligence—all core strengths of REoptimizer®. By transforming lease administration into a strategic advantage, the platform empowers organizations to save time, reduce costs, and enhance operational efficiency at scale.
Whether you oversee five properties or five thousand, adopting a robust lease management software solution like REoptimizer® ensures your organization stays compliant, data-driven, and future-ready.
Learn More
Coworking (or co-working) is no longer a fringe movement—it’s a portfolio lever for Fortune 500 companies throughout the country.
Once the province of freelancers and small businesses, coworking spaces have become a legitimate part of how major corporations structure their office space strategy. The data now points to a sector that’s expanding not through hype but through disciplined, data-driven growth.
According to CoworkingCafe’s 2025 report, there are 8,420 coworking locations across the U.S., occupying 150 million square feet of flexible office space—a modest 2.1% of total office space inventory, yet one of the fastest-growing segments of the market.
What’s more telling is the scale and intent behind that growth. It’s not just entrepreneurs filling shared workspaces; it’s large companies—Amazon among them—testing new markets, piloting hybrid work models, and rethinking the meaning of “portfolio optimization.”
The Rise of Coworking Adoption in Office Space
Major organizations are increasingly turning to coworking space models as part of their real-estate strategy.

For instance, Amazon has entered into significant flexible-workspace arrangements with WeWork, leasing sub-space in buildings such as Five Manhattan West (about 112,000 sq ft) and growing its footprint beyond its own traditional leases.
For companies like Amazon, leasing blocks of coworking space serves a dual purpose:
- Portfolio agility: the ability to scale space up or down without 10-year lease obligations.
- Market intelligence: the opportunity to test new geographies, workforce patterns, or sub-brand presence before committing long-term.
Other large companies—including traditional corporate firms—now allocate 5–10% of their footprint to flexible office space, often distributed across major cities.
These coworking spaces provide proximity to clients, faster onboarding for new projects, and a hedge against uncertain headcount forecasts.
From a CFO’s perspective, coworking shifts occupancy cost from capital expenditure to operating expense, freeing balance-sheet flexibility. But that flexibility comes with nuance—and cost.
From Hot Desks to Private Offices
The spectrum of coworking (or shared workspace) models now includes:
- Hot desks / hot desk memberships: Unassigned seating in a shared work-area with flexible access.
- Dedicated desks / dedicated desk memberships: A reserved desk in a shared space for an individual.
- Private offices / private rooms / team suites: Enclosed space for a single individual or small team, within a larger coworking environment.
- Enterprise suites / large-floor footprints: Designed for larger companies seeking flexible terms and amenity-rich settings.
- Business-centre-style hubs offering reception services, meeting rooms, communal lounges, networking events, community manager oversight, and other value-added services designed to deliver a professional environment.
The Price of Flexibility: Why Coworking Often Costs More (at First)
One persistent misconception among executives is that coworking equals cheaper space. It doesn’t—at least not up front.

A coworking membership with a dedicated desk averages about $225/month nationally, but in core markets like Manhattan or San Francisco, rates often exceed $339–$400/month per person. A private office suite for a 20-person team can run 15–25% more per square foot than a comparable traditional office lease.
Why pay more? Because the coworking environment bundles services—high-speed internet, utilities, reception services, meeting rooms, community managers, and full receptionist and custodial services—into one turnkey agreement. More importantly, it buys time and optionality, which for a corporate portfolio can be worth far more than marginal rent differences.
Coworking is not a discount play; it’s a flexibility premium.
The Evolution from Remote Work to Scalable Infrastructure
Before the pandemic, coworking spaces functioned primarily as overflow for remote workers or project teams. Now, they operate as an integral extension of enterprise infrastructure.
Many different companies are adopting a hub-and-spoke model: maintaining flagship headquarters (often downsized) while distributing coworking spaces in major cities for hybrid staff. In cities like Dallas-Fort Worth and Atlanta, there are now more than 280 coworking locations each, serving as nodes in corporate ecosystems that favor flexible access, cost savings, and sense of community without the weight of a permanent lease.

In San Francisco, the coworking market continues to thrive, blending creative freelancers, tech startups, and large companies under one roof. For enterprise users, these San Francisco coworking spaces serve not as a retreat from the traditional office environment, but as experimental labs for company culture—spaces where teams from the same company can share ideas alongside other spaces of creative professionals, stimulating innovation that’s hard to reproduce in a corporate tower.
The Real Economics of the Coworking Model
Executives evaluating coworking models must distinguish between cost per square foot and value per employee. While coworking can run higher on a per-foot basis, utilization rates are significantly better. A traditional office might see 55–60% peak occupancy; coworking spaces often achieve 80–90%, because flexible terms and hot desk rotations compress underused space.
In other words, slightly more than half your workforce in a static office equates to full utilization in a shared workspace. That math alone justifies paying a premium for coworking providers who can offer private rooms, dedicated desks, and enterprise-grade privacy without long leases.
Moreover, coworking lies at the center of how companies are redefining risk. When leases are flexible, capital risk shifts from occupier to operator. That shift, for CFOs managing volatile headcount or M&A integration, is strategically significant.
Global Reach, Local Insight
While the U.S. leads with more than 150 million square feet of flexible office space, tens of thousands of coworking spaces worldwide now serve as modular extensions of multinational portfolios—from Berlin’s creative cooperatives to Singapore’s business centers and London’s hybrid innovation hubs. For international enterprises, this global network of coworking spaces offers more than real estate—it provides strategic optionality.
The advantage isn’t just speed. It’s data and intelligence. Global coworking providers now track occupancy, collaboration patterns, and utilization across continents, giving corporate real estate teams the ability to make data-driven decisions on where talent performs best.

Strategic Takeaways for Executives
- Treat coworking as infrastructure, not overflow. The coworking model is now a legitimate asset class. Integrate it into portfolio planning, not just as temporary swing space.
- Quantify flexibility. Build a cost model that captures not only rent per square foot but productivity, speed to occupy, and exit agility.
- Segment by function, not department. Creative, client-facing, or early-stage teams often thrive in shared space environments; confidential units may still require private offices or traditional offices.
- Track performance. Analyze utilization data from coworking memberships—hot desk usage, meeting-room bookings, and expansion options—to inform future real-estate strategy.
- Mind the brand. Choose professional workspaces that reflect your company’s identity. The right coworking environment can amplify company culture; the wrong one can dilute it.
Company Culture in a Co-working World
For C-suite executives managing large corporate portfolios, the rise of coworking spaces is less about trend and more about timing. In an era where hybrid work, cap-rate compression, and workforce fluidity redefine office economics, coworking offers a pragmatic middle ground: flexible terms, speed, and an inspiring environment without the burden of fixed assets.
Yes, it comes at a higher initial cost, but the tradeoff—strategic flexibility, reduced long-term liability, and access to vibrant communities—is one the smartest companies are already pricing into their future.
The coworking movement isn’t a threat to corporate real estate. It’s a mirror—reflecting what the modern office must become: flexible, data-driven, and intentionally human.
If there’s one storyline that sums up 2025’s office market, it’s this: tenants are doubling down on quality and skipping everything else.
Call it “rightsizing,” “prime-first,” or just common sense…companies are shrinking their footprints, upgrading their addresses, and putting every dollar where it will actually get people to show up. The catch? New supply has stalled. That puts a hard cap on how far the flight to quality can run before it runs into a wall.
Below, we’ll use Atlanta as a clean case study (because the numbers there are explicit), then widen the lens to what this means nationally for leasing strategy, rent trajectories, and the growing “reuse or lose” reality for Class B/C.
Atlanta as Microcosm: The Numbers Don’t Lie
Atlanta’s latest read is the picture of a bifurcated market. In Q3 2025:
- Leasing activity jumped 41% quarter-over-quarter to ~2.1M SF—and Class A captured ~1.7M SF of that volume. In other words, the demand surge went almost entirely to the nicest product.
- Rents overall were basically flat at $32.38/SF (FSG), but Class A crept up to $34.35/SF, signaling that pricing power is concentrating in the top tier.
- The construction pipeline shrank 40% quarter-over-quarter to ~342K SF—with ~224K SF of that tied to a single Midtown project (1072 West Peachtree). That’s not a typo; the pipeline is tiny.
Those figures match, and are also echoed in industry coverage: Partners Real Estate’s analysts warned that a pipeline this thin “is going to have implications down the road,” particularly for tenants hoping to upgrade into brand-new space.

Reporting on the same trend, Bisnow underscored the 40% pipeline slide and the concentration of what little’s left. Translation: demand is hunting Class A at the exact moment supply is drying up.
If you zoom out a touch: more than 80% of Atlanta’s 2024 leasing happened in Class A buildings. This is a structural preference that kept strengthening into 2025.
So What Happens When Class A Runs Thin?
The punchline: as Class A options narrow, pricing power shifts from concessions to rate and term, not all at once, but steadily as the shelf empties.
- Rents: You can expect a slow grind up in Class A while the blended market stays flat thanks to B/C drag. That’s exactly what Atlanta just showed: flat overall rents, rising Class A (Q3: ~$32.38 FSG market-wide vs. ~$34.35 Class A).
- Concessions: The best addresses will dial back free rent and TI. Normally, new deliveries cool off hot Class A demand; with the pipeline down ~40%, that pressure valve is basically shut. Relief is measured in years, not quarters unless financing loosens.
- Who fills the gap: With “brand-new” scarce, renovated A-minus (solid locations, upgraded lobbies/amenities/systems) becomes the practical upgrade path. This is where tenants land when trophy space is tapped out.
Net effect: If the flight to quality chits a supply ceiling, the market will start rewarding well-located, well-renovated assets almost as much as ground-up “shiny new.”

Rightsizing vs. Downsizing: The New Tenant Playbook
The past two years weren’t a stampede to empty space they were a smarter allocation of it. Three moves we see again and again:
Right-sizing, not downsizing. The goal isn’t just to cut square feet; it’s to optimize: fewer, better, more useful square feet.
Trinity Partners Office Leasing Director Cori Nuttall says her team has seen more professional services firms move to comparable new buildings rather than renewing in the last 90 days. “We’re seeing more lateral moves,” she says.
These “lateral” moves are cost plays—especially for leases inked 5–10 years ago, when the market, demand, and leverage looked very different. Back then, base rents reflected a healthier landlord-tenant balance, and tenants couldn’t push like they can today. Add years of compounded escalations, and plenty of occupiers are now overpaying relative to today’s negotiable environment.
- If a tenant took CPI escalations a few years ago, they’re eager to retire that exposure and convert to steady, fixed bumps.
- Even when the building quality is similar, a renewal or lateral move can reset the cost stack: base rent, escalations, TI amortization, and OPEX sharing.
Bottom line: these moves look lateral on a flyer, but they reset costs in practice.
All of this supports the broader push to “do more with less”—smaller, higher-quality, hybrid-ready spaces in better locations with better amenities. That’s why more companies are thinking critically about renewals and renegotiations instead of sleepwalking into whatever’s next.

The Lease-Term Tug-of-War
Tenants want optionality. Landlords need duration to amortize TIs and justify capex. That gap is widening as construction prices and long-lead components keep deals complex and costly. The market is meeting in the middle with:
- Shorter base + options: Five years base with one or two extension options can bridge the gap between tenant agility and landlord underwriting.
- Step rents: Predictable fixed increases (vs. CPI links) are back in favor with occupiers who got burned by inflation.
- Phased TIs: Front-load essentials, defer nice-to-haves to option windows to keep initial checks smaller.
Expect more deals to look like partnerships—tailored scopes, creative amortization, outsized concessions when an anchor creates stack value, and in return, tenants give a little on term (e.g., seven vs. five) to cover build-out. That’s consistent with on-the-ground brokerage anecdotes across Sun Belt office markets.
Why Class B/C Is Getting Repurposed
While the top of the market stabilizes, Class B/C is being thinned out—by conversions, demolitions, or prolonged mothballing. This matters for two reasons:
- Less total office inventory = faster normalization of vacancy.
- Better product mix = clearer value proposition for the office that survives.
The conversion pipeline is real. Nationally, office-to-apartment conversions are set to hit ~70–71K units in 2025, up from ~23K in 2022. Cities with meaningful incentives (NYC, DC, LA) dominate the pipeline. It’s not a magic bullet (many projects are hard) but it’s enough to move the needle in key CBDs.
Beyond apartments, CBRE now tracks conversions and demolitions outpacing new office deliveries in 2025—meaning the net effect is shrinking office supply, which is exactly what a broader office recovery needs.

The “Ceiling” Question: What if Flight to Quality Runs Out of Runway?
The market is still unraveling…Here’s the likely path:
- 2025–2026: Class A absorption stays positive; rents inch up, concessions narrow at the best addresses; highly amenitized, well-located A-minus steps into the upgrade role. Pipeline is too thin to change the math.
- 2026–2027: As rates stabilize and financing opens, select new starts return in the best submarkets. But those projects deliver 2028+, not tomorrow.
- Through 2030: The sector emerges smaller but healthier—a durable Class A core, thinned mid-tier stock, and a meaningful slice of former offices living new lives as residential or mixed-use. Bifurcation becomes the baseline, not a phase.
Playbooks (That Actually Work) for 2025 Tenants
1) Start earlier than you think.
If you plan to upgrade, shop 12–18 months ahead in constrained submarkets. Backfill space gets snapped up first, premier towers have waiting lists, and sublease “deals” that check the boxes move quickly. Atlanta’s 41% QoQ leasing jump is exactly the kind of surge that clears the shelf.
2) Model the real cost of staying vs. moving.
Don’t let “lateral” distract you. If a move swaps CPI escalations for fixed steps, trims 10–20% off your footprint, and delivers a modern plan that actually supports in-office work, the total cost of occupancy often drops—even when face rent doesn’t. Build side-by-side P&Ls with TI amortization, downtime, and churn risk.
3) Use flex product as a risk valve.
Combine a smaller core lease with flex blocks for peaks. It’s a cleaner way to de-risk headcount uncertainty while you measure real utilization.
4) Design smarter, not pricier.
Fit-out guides show costs remain elevated—even if escalation is easing—so value-engineer your spec (e.g., reuse serviceable ceilings/MEP where possible, prioritize acoustics, daylight, and collaboration areas). You can deliver a high-impact hybrid floor without gold-plating. CBRE+1
5) Be intentional about term.
The market wants you at seven to 10 years; your CFO wants three. The compromise is options, expansion rights, and contractual flex (swing space, early-term window with pre-set fees). Tighten your business case, then trade duration for the TIs you actually need.

Make 2025 Work for You
Quick take: Class A is getting tighter in some cities, costs are noisy, and “wait and see” shrinks your options. You don’t need more spreadsheets…you need a clear plan.
What REoptimizer® helps you do (without the headache)
- Know your best move: Renew, make a lateral move, or shrink-to-upgrade—see the total cost for each in plain dollars.
- Right-size with confidence: Plug in headcount and office attendance to size the right footprint (not just a smaller one).
- Tame escalations: Compare CPI vs. fixed bumps and see the 5–10 year cash impact before you counter.
- Pick a term that fits risk: Test 5/7/10-year options with extensions, early-outs, and expansion rights—side-by-side.
- Use flex smartly: Add flex seats for peaks or pilots and see when higher $/SF beats capex and long commitments.
- Pressure-test TIs: Model free rent, TI offers, and phased build-outs so you know how much term you really need.
Don’t wait. Learn how REoptimizer® can give your portfolio the edge it needs in the midst of so much office market uncertainty.
