Recent industry benchmarks indicate that while 72% of organizations still prioritize cost reduction, the most successful firms are shifting toward “elastic portfolios.”
This approach demands the right commercial real estate (CRE) software to treat physical space as a dynamic variable rather than a fixed overhead. Because we’re dealing with a nuanced market. Large users are returning to the market with force, yet the availability of prime commercial properties is hitting record lows.
For a company managing hundreds of thousands of square feet across multiple jurisdictions, the reliance on fragmented spreadsheets is no longer just inefficient—it’s a liability.
In this environment, cost management and budget efficiency is top priority. According to recent industry benchmarks, firms utilizing dedicated commercial real estate software have seen up to a 30% reduction in CRE costs and a staggering 90% improvement in time efficiency. Let’s discuss.

The Data-Driven Reality of Large-Scale Portfolios
For the C-suite, the “cost of doing business” has been redefined by the delta between leased capacity and actual utility.
In a high-interest-rate environment where every square foot must justify its existence on the balance sheet, “gut feel” asset management is a fiduciary risk. The 2026 market doesn’t just penalize inefficiency; it actively outpaces those who lack real-time visibility. To maintain a competitive target market position, leaders must move beyond aggregate data and into granular, actionable insights.
- Office Optimization: With office utilization rates stabilizing, data reveals that up to 71% of corporate office spaces could accommodate nearly four times their current usage. Without CRE software tools, this inefficiency remains invisible, costing firms millions in “ghost” square footage.
- Industrial Logistics: For warehouse users, the focus has pivoted to power availability and 3PL (Third Party Logistics) integration. In 2026, the primary bottleneck for logistics isn’t just location—it’s the ability of the company to track and secure power-ready sites before they hit the open market.
Leveraging AI Integration for High-Stakes Deal Making
The most significant transformation in commercial real estate this year is the move from experimental AI to intelligent infrastructure. AI integration is now the engine behind every high-value transaction.
Predictive Market Intelligence
Traditional brokers and agents rely on historical data, which is inherently backward-looking. Modern commercial real estate software uses predictive analytics to:
- Forecast Pricing: Improve pricing accuracy by up to 25%, mitigating the risks of overpaying in “hot” micro-markets.
- Early-Mover Advantage: Firms using AI-driven analytics are identifying properties and deals 3-5 days before competitors. In a high-velocity market, this window is the difference between securing a prime asset and losing it to a rival.
- Automated Document Analysis: Large-scale tenants often manage thousands of lease pages. AI can now automate the document review process, extracting critical details and compliance requirements with 98% accuracy, reducing human error in financial operations.
Maximizing NOI: Efficiency by the Numbers
For the CFO, the value of CRE software is measured in Net Operating Income (NOI). By automating day-to-day tasks, organizations are seeing 30%–45% reductions in operational costs.
Key Features for Enterprise Optimization
| Strategic Feature |
Business Impact |
Data Point (2026) |
| Automated Reporting |
Eliminates manual data entry silos. |
75% reduction in Q&A time for audits. |
| Occupancy Sensors |
Rightsizes footprint based on real-time use. |
Potential to reduce square footage by 30%. |
| Smart Building HVAC |
Optimizes energy use for warehouse/office. |
10%–30% energy savings via AI-load balancing. |
| Lease Management |
Tracks escalations, breaks, and renewals. |
15%–25% better portfolio performance. |
The Critical Role of REoptimizer® in Transaction Management
In a market where “operations have become strategy,” general property management tools are no longer enough. Large-scale tenants require a system built specifically for the occupier—one that provides a secure and transparent view of the entire network.
Why REoptimizer® is the Choice for C-Suite Leaders
While most commercial real estate software is designed for landlords or brokers, REoptimizer® is the critical transaction management software that levels the playing field for the tenant.
- Key Site Drivers™ (KSD™): Use our patented system to determine which sites are truly worth pursuing. By inputting your specific business needs and criteria, you get an objective, data-backed ranking of properties—avoiding the subjective bias of third-party agents.
- Market Benchmarking: Are you over-market? REoptimizer® allows you to directly compare your current sites to real-time market rates. This ability empowers your team to negotiate from a position of strength, leading to more deals with better terms.
- Project and Lead Tracking: Centralize every lead, transaction, and development project on a single landing page. This ensures your team stays aware of critical dates and lease obligations across a global portfolio.

Future-Proof Your Portfolio
The commercial real estate industry in 2026 belongs to the disciplined. The “flight to quality” isn’t just about the physical building; it’s about the quality of the data and software used to manage it. To stay ahead, your company must transition from reactive management to proactive optimization.
Don’t let your business be slowed down by legacy systems and fragmented spreadsheets. Secure your success by leveraging the power of automation, AI integration, and the industry-leading expertise of REoptimizer®. Ready to see the data-driven difference?
Visit our website today to request a demo. Let us show you how REoptimizer® can help you manage, save, and optimize your large-scale portfolio to meet the demands of 2026 and beyond. Contact us today to secure your seat at the table of the future.
Book a Demo
Commercial real estate has officially entered a “sorting year.” Lenders are no longer just looking at property types; they are conducting “ruthless” forensic audits on Debt Service Coverage Ratios (DSCR), sponsorship liquidity, and Capex runways.
For corporate tenants with massive office and warehouse footprints, this financial pressure on landlords translates directly into operational risk. From “jingle mail” ownership transfers to the sudden evaporation of Tenant Improvement (TI) allowances, the stability of your lease is now tied to the “financeability” of your landlord’s asset.
The 2026 CRE Underwriting Outlook
For the last decade, corporate real estate (CRE) was a game of location and scale. In 2026, the game has changed to intelligence and liquidity.
As a corporate tenant managing a diverse portfolio of high-stakes office space and mission-critical warehouse hubs, you are about to feel the ripple effects of a lending market that has gone from “wait-and-see” to “search-and-destroy.”

Trepp’s research team calls it a “sorting year”—a period where the line between a stable asset and a distressed one is drawn with a red pen.
Here is the data-driven reality of how 2026’s ruthless underwriting will impact your bottom line—and why your transaction management strategy needs an immediate upgrade.
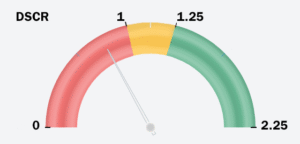
1. The DSCR Death Spiral: Why Your Rent Isn’t Enough Anymore
In 2021, a 1.25x DSCR was the gold standard. In 2026, lenders are recalibrating for a “higher-for-longer” rate environment. Lenders are now stress-testing assets against flatter or even negative rent growth.
-
The Impact on You: If your landlord’s loan is coming due and they can’t clear the new, higher DSCR bar, they are in “triage.”
-
The Risk: A landlord in triage mode will cut every “non-essential” expense. This means the lobby renovations stop, security shifts are reduced, and the HVAC system you complained about six months ago will continue to fail.
-
The Office/Warehouse Divide: While industrial assets generally have stronger cash flow, the “ruthless” underwriting of 2026 is hitting older distribution centers hard, forcing landlords to choose between paying the mortgage or upgrading your loading docks.
2. The “Capex Runway” Test: Is Your TI Allowance Real?
Lenders are now probing Capex runways with unprecedented scrutiny. They want to know if the money for “story” assets—those value-add warehouses or “reimagined” office spaces—is actually in the bank or just a line item in a pitch deck.
-
The “Haves” vs. the “Have-Nots”: Institutional sponsors with deep pockets are being welcomed by lenders. Small-to-mid-cap landlords are being told to “re-up” or “walk.”
-
The Tenant Trap: If you are negotiating a renewal that includes a significant Tenant Improvement (TI) allowance, beware. A landlord who cannot pass the 2026 underwriting test may sign your lease today but lack the liquidity to pay your contractors tomorrow.
3. The “Jingle Mail” Resurgence and Ownership Volatility
“Jingle mail”—the practice of a landlord mailing the keys back to the lender—is no longer a ghost story; it’s a 2026 strategy. With a “maturity wall” of loans hitting the market, many owners are opting for deed-in-lieu transfers.
A foreclosing lender could technically terminate your lease in certain jurisdictions if you are paying below-market rent.For a corporate tenant, a building’s financial distress is a direct threat to your business continuity. Use the following checklist to evaluate your current exposure:
The 2026 Corporate Portfolio Risk Checklist
When lenders apply 2026’s heightened DSCR and Capex Runway tests, they triage properties into winners and losers. As a tenant with millions in lease obligations, you must monitor these three critical factors:
-
Ownership Volatility (The Lender Takeover):
-
Office Portfolio Impact: High risk of “accidental landlords”—banks or special servicers who lack the incentive to provide a high-quality tenant experience. You may face delayed responses to lease inquiries and a lack of long-term vision for the asset.
-
Warehouse/Industrial Impact: A lower risk of total abandonment, but often leads to “loan-to-own” private equity takeovers. New owners may look for technical lease defaults or hike “pass-through” expenses to maximize short-term yield.
-
The Maintenance Deficit (Cost-Cutting as Survival):
-
Office Portfolio Impact: Visible degradation such as slower elevators, dated common areas, and cooling issues. This makes “return-to-office” (RTO) mandates nearly impossible to enforce for your staff.
-
Warehouse/Industrial Impact: Manifests as deferred structural maintenance. Neglecting roof repairs or parking lot integrity can lead to localized flooding or equipment damage, impacting your supply chain.
-
Expansion Constraints (The Capital Lockdown):
-
Office Portfolio Impact: Landlords may be fundamentally unable to fund build-outs for new floors. Even with a signed expansion option, the lack of liquidity can leave you with a half-finished shell.
-
Warehouse/Industrial Impact: A severe lack of capital for infrastructure upgrades. If you need more power for automation or cold-storage conversions, a landlord struggling to refinance will likely deny the request or demand you fund 100% of the cost.
Critical Strategy Note: In an era of ownership volatility, the SNDA (Subordination, Non-Disturbance, and Attornment) agreement is your most important legal shield. Without it, a foreclosing lender could technically terminate your lease in certain jurisdictions if you are paying below-market rent.

Learn More
The U.S. commercial real estate market is not behaving uniformly — and that matters for enterprise real estate strategy. Let’s look at the market from a bird’s eye view.
Five data-backed realities are shaping tenant leverage heading into 2026:
- Pricing divergence is driven by liquidity and asset quality, not geography
- New supply is collapsing faster than demand is recovering
- Net absorption remains negative at the macro level
- Lower interest rates are increasing transaction velocity — not equalizing leverage
- Negotiating power is now asset-specific, not market-wide
For Fortune 1000 occupiers, this environment rewards precision, speed, and portfolio-level visibility — not broad market assumptions.
So let’s dive into these trends and discuss how to keep your portfolio nimble an well-performing in this environment.

The CRE Market Isn’t Splitting — It’s Sorting
Most commentary describes today’s commercial real estate environment as a “two-tier market.” That framing suggests a simple divide between winners and losers. The data tells a different story.
What’s happening instead is a sorting of assets and owners based on constraint — specifically, who can afford to wait and who cannot.
This sorting is driven by three measurable factors:
- Access to capital: Well-capitalized owners can refinance, carry vacancy, and delay leasing decisions. Less-capitalized owners often must trade rent, concessions, or term flexibility to secure occupancy.
- Ability to hold through uncertainty: Owners with longer investment horizons can withstand slower leasing velocity and evolving space utilization. Others are forced to reprice assets in real time.
- Flexibility to reposition assets: Buildings that can be upgraded, re-tenanted, or adapted to shifting tenant needs are retaining value. Assets without repositioning options are absorbing the bulk of pricing pressure.
As a result, pricing is adjusting selectively, not uniformly.
The market is clearing quietly — through deal terms, concessions, and asset-level repricing — rather than through broad distress or forced sales.
Pricing: Two Indexes, Two Operating Realities
If we look at CoStar’s Commercial Repeat Sale Indices (CCRSI), we can observe two distinct pricing behaviors occurring at the same time.
Premium / Core Assets (Value-Weighted Index):
- +0.4% month over month (November)
- Six consecutive monthly gains
- +1.1% quarter over quarter
- −1.3% year over year
This index is driven by larger, higher-value transactions, typically involving institutionally owned assets in liquid markets.
Smaller / Secondary Assets (Equal-Weighted Index):
- −0.9% month over month
- −0.7% quarter over quarter
- Flat year over year
This index reflects the more numerous, lower-priced transactions that dominate secondary and tertiary properties.

Why These Two Indexes Matter To Corporate Tenants
This divergence is not simply “major markets outperforming secondary markets.” It reflects who still has pricing power — and why.
- Assets with institutional liquidity and long-term relevance are being priced on their ability to withstand uncertainty, not on near-term occupancy alone.
- Assets without capital buffers are being repriced to clear — often quietly — through lower transaction values and more flexible leasing terms.
For corporate occupiers, the practical implication is clear: lease economics now vary sharply by building, even within the same submarket.
Market averages increasingly obscure:
- Where landlords are willing to concede
- Where pricing discipline is holding
- Where renewal leverage actually exists
Supply: The Construction Cliff Is A 2026–2028 Problem
Today’s availability reflects yesterday’s development decisions. The construction data now coming into focus shows that far fewer projects are replacing the space currently delivering — setting up a materially different supply environment in 2026–2028.
Key Construction Data:
- Total completions across office, retail, and industrial: 3M SF in 2025
- Down 34.2% year over year
- Q4 new property openings fell below 100M SF, the lowest level since 2013
This decline reflects a sharp reduction in projects entering and advancing through the development pipeline — not a temporary delay.
Why The Impact Is Delayed For Corporate Tenants
Current leasing conditions still benefit from:
- Projects approved prior to rate hikes
- Developments already under construction reaching completion
These deliveries create the impression of adequate supply today.
The constraint emerges later, when:
- Fewer new projects replace delivered space
- The pool of modern, functional buildings shrinks
- Tenants compete for the same subset of “approved” assets
As a result:
- Premium space tightens even if headline vacancy remains elevated
- Choice narrows faster than market statistics suggest
- Negotiating leverage shifts unevenly across buildings
This pattern is already evident in newer Class A office properties and select industrial corridors, where availability has tightened despite broader market softness.

Demand: Net-Negative Doesn’t Mean Evenly Weak
Macro Demand Snapshot
- U.S. commercial nonresidential space is projected to lose ~100M SF of net tenants in 2025
- This is the most negative absorption since 2009
The Important Nuance
Demand is not disappearing uniformly — it is rotating:
- Enterprises are consolidating footprints
- Tenants are upgrading into higher-quality assets
- Commodity space is bearing the brunt of vacancy
Recent data shows improving absorption in prime office assets, even while the broader market remains soft.
Translation: Your leverage depends on where you are moving — not just whether you are moving.
Interest Rates: Easier Capital, Uneven Impact
What Changed In 2025
- The Federal Reserve cut rates three times since September
- Target range dropped to 3.50%–3.75% by December
- Borrowing costs are now at their lowest level since 2022
What Didn’t Change
Lower rates:
- Increase transaction activity
- Improve refinancing options for strong owners
- Support pricing for premium assets
They do not:
- Force well-capitalized landlords to concede aggressively
- Restore leverage uniformly across all buildings
- Eliminate distress in secondary assets
Rate cuts increased movement — not symmetry.
What This Means For Corporate Tenants
1. Leverage Is Now Asset-Specific
The idea of a universally “tenant-friendly market” no longer holds.
Negotiating strength depends on:
- The owner’s capital position
- The asset’s long-term relevance
- How critical your tenancy is to the landlord’s strategy
2. Secondary Assets Offer Tactical Opportunity
Buildings facing:
- Refinancing pressure
- Tenant concentration risk
- Limited repositioning options
are often more willing to:
- Trade rent for occupancy
- Extend TI packages
- Reset economics at renewal
These opportunities require visibility and speed.
3. Supply Constraints Will Show Up Later — Not Now
The sharp drop in construction today increases the odds of:
- Fewer high-quality options in 2026–2028
- Less choice for ESG-, talent-, or logistics-driven requirements
- More competition for newer assets
Planning ahead matters more than reacting later.
Why Transaction Management Has Become A Strategic Control Point
The current commercial real estate environment is not just fragmented — it is asymmetric.
Pricing, supply, and leverage now vary by building, by owner, and by timing. In this kind of market, outcomes are no longer driven by where you operate, but by how quickly and consistently decisions move from insight to execution.
For large occupiers, the real risk is not misreading the market, but allowing sound strategy to erode through slow, inconsistent execution.
-
Concessions negotiated but not captured
-
Approvals delayed while leverage shifts
-
Inconsistent deal terms across similar assets
-
Portfolio decisions made on incomplete or outdated data
This is where transaction management moves from administrative support to strategic infrastructure.
What REoptimizer® Enables In Practice
REoptimizer® gives corporate real estate teams a single operational system to manage complexity at scale:
-
Asset-Level Intelligence At Portfolio Scale
Centralizes deal data across regions, asset types, and brokers so negotiations reflect real-time leverage — not market averages.
-
Disciplined, Defensible Decision-Making
Standardizes underwriting assumptions, approval workflows, and deal inputs to reduce variability and governance risk.
-
Faster Conversion Of Leverage Into Economics
Shortens LOI-to-close timelines so negotiated advantages are not lost to delay, shifting conditions, or internal friction.
-
Consistent Economics Across The Portfolio
Enables side-by-side comparison of concessions, terms, and obligations so value is captured systematically — not deal by deal.
-
Post-Signature Accountability
Ensures negotiated terms survive execution and are visible beyond the transaction, reducing leakage over the lease lifecycle.
In a market where leverage changes asset by asset, execution discipline becomes a source of leverage itself.
The Bottom Line For Enterprise Occupiers
The defining feature of today’s commercial real estate market is not volatility. It is selectivity.
Capital, supply, and demand are no longer moving together — and neither is negotiating power.
For Fortune 1000 tenants, winning in this environment requires:
-
Asset-level insight, not market generalizations
-
Portfolio-wide visibility, not regional silos
-
Faster, more disciplined execution, not reactive deal-making
Organizations that adapt their operating model — not just their strategy — will secure flexibility, control risk, and preserve value as the market continues to sort. REoptimizer® is your tool to see your entire portfolio strategically in the midst of this environment. Learn more about how it can level up your commercial real estate in 2026 and beyond.
Learn More
Frequently Asked Questions
Is 2026 A Tenant Market Or A Landlord Market?
Neither, broadly speaking. Data shows leverage is asset-specific, with premium properties firming and secondary assets repricing downward.
Why Are Premium Assets Rising If Demand Is Weak?
Capital is prioritizing assets that can absorb uncertainty and remain liquid. At the same time, tenants are rotating into higher-quality space even as total footprints shrink.
How Does Reduced Construction Affect Corporate Tenants?
Lower deliveries today increase the risk of future scarcity in high-quality space, especially for tenants with modern, ESG, or operational requirements.
Triple net (NNN) leases are a go-to structure across commercial real estate, especially for industrial and flex properties. On paper, they’re simple:
Base rent + taxes + insurance + maintenance (CAM/OPEX).
Landlords like the steady return. Tenants like the transparency and control.
But here’s the catch: NNN leases aren’t fixed-cost. They’re variable-cost agreements tied to expense categories that can swing sharply—especially as buildings age. Over time, that volatility can:
If your portfolio includes mixed-age facilities, age-driven OPEX risk may be a bigger financial story than rent. Let’s discuss.
The Built-In Exposure of Triple Net Leases
In a true triple net structure, tenants typically carry most operating expense responsibility beyond base rent, including:
-
Property Taxes: reassessments, mill rate changes, local incentives, shifting valuations
-
Insurance: market cycles, regional risk, asset condition, claims history
-
Maintenance & Repairs (CAM/OPEX): the largest—and least predictable—driver
Think of these as moving variables, not line items. They flex with market conditions, landlord behavior, and building performance. And they rarely move in a straight line.

Why Industrial Tenants Feel It First (and Worst)
Industrial users often see the most immediate impact because so many costs are passed through—and because maintenance decisions are frequently tenant-managed. That means OPEX shifts with:
-
System performance (HVAC, roof, paving, dock equipment)
-
Vendor pricing and availability
-
Seasonality and operational intensity
-
Deferred capital conditions inherited at move-in
A quick reality check:
Across a multi-site network, that spread can translate into six figures of unplanned spend annually.

Building Age Isn’t a Detail—It’s a Cost Multiplier
Under NNN terms, age becomes a direct financial variable. Older properties usually bring:
-
Higher repair frequency
-
Less efficient mechanical systems
-
End-of-life components (roof, RTUs, electrical, paving)
-
Higher emergency maintenance risk
Deferred Maintenance: The “Rent Discount” Trap
In older assets, landlords may delay major capital replacements knowing an NNN tenant absorbs the operating burden. A “competitive” rent rate can hide upcoming expense spikes that show up in year 2, 4, or 7—right when you’re trying to stabilize operations.
Energy and System Inefficiency Adds Up Fast
Older industrial buildings often lack modern efficiency standards—HVAC performance, insulation, lighting, controls. If you’re paying utilities directly (common in NNN), inefficiency becomes a recurring tax that compounds over the full term.
Maintenance Escalation Isn’t Linear
Maintenance doesn’t rise gradually—it often jumps once major systems hit the 15–20 year range. If the roof, mechanical, or electrical systems are near that threshold, your cost curve can steepen mid-term—not at renewal.
Bottom line: a low base rent can mask a high effective rent once age-adjusted OPEX is included.

Model Total Cost of Occupancy (TCO), Not Just Rent
The more durable approach is Total Cost of Occupancy (TCO) modeling across the lease term—rent plus projected OPEX and capital exposure.
Evaluate Life-Cycle Cost, Not Just Lease Cost
Run scenarios that incorporate:
-
Age-based maintenance trajectories (roof, HVAC, lighting, paving)
-
Historical tax reassessment patterns
-
Insurance volatility (especially for older or high-value assets)
Even conservative assumptions will quickly reveal where “cheap rent” becomes high all-in occupancy cost.
Negotiation Moves That Actually Reduce Risk
Tie Tenant Improvements to Asset Condition
If the building needs modernization—mechanical upgrades, lighting retrofits, dock equipment—push for landlord participation. Improvements with residual life beyond your lease term often increase property value, which makes them easier for landlords to justify.
Define Maintenance vs. Capital Replacement—In Writing
This is non-negotiable in older facilities. Lease language must clearly separate:
The difference determines whether a failure becomes a manageable repair—or a major unbudgeted capital hit.
Require OPEX Transparency and Audit Rights
Add provisions for:
-
Detailed CAM/OPEX statements
-
Standardized backup documentation
-
Audit rights and dispute windows
For multi-site occupiers, centralized audits across the portfolio can uncover recurring discrepancies and recover overcharges.
Control vs. Responsibility: The Hidden Trade-Off in NNN
NNN leasing promises visibility and operational control—but across dozens (or hundreds) of sites, that control becomes complexity.
What you gain
-
Cost management through bidding, preventative maintenance, and efficiency upgrades
-
Operational alignment with your temperature, security, and logistics needs
-
Line-item transparency
What you inherit
-
Cost volatility in taxes, insurance, and repairs
-
Administrative burden across vendors, invoices, audits, and site conditions
-
Age amplification: older assets = less predictability
This is where many portfolios get surprised: control doesn’t guarantee predictability.
Turn NNN Exposure Into an Advantage With Operational Discipline
NNN shifts risk to the tenant—but disciplined operators can turn that into cost leadership through structured portfolio management:
-
Preventive maintenance optimization: extend system life and reduce emergency repairs
-
Energy retrofits: lighting and controls upgrades can meaningfully lower utility spend
-
Portfolio-level insights: recurring inefficiencies and overcharges become visible only when data is centralized
Without integrated data, most tenants never see the full trendline—they just keep paying the bills.

The Strategic Shift: From Lease Thinking to Lifecycle Thinking
Triple net leases make one thing clear: you’re not just leasing space—you’re operating an asset. That means performance depends as much on physical condition and operating discipline as on the lease terms.
Sophisticated occupiers are shifting toward lifecycle-based governance, evaluating sites by:
-
Age and deferred maintenance exposure
-
Energy intensity and upgrade potential
-
OPEX volatility mapping
-
Renewal vs. relocation equivalency
That’s where platforms like REoptimizer® become essential—turning occupancy cost into a measurable, optimizable variable.
The Bottom Line
Triple net leases reward diligence and punish complacency. They offer transparency—but they also transfer volatility and aging-asset risk downstream.
In today’s environment of rising maintenance costs, insurance swings, and aging industrial stock, lease structure is strategy.
If you manage a large, mixed-age portfolio, don’t just negotiate rent. Model lifecycle exposure, track OPEX trends, and quantify the real cost of building age.
Because in a triple net world, the number on the lease is only half the story.
Model the real cost of occupancy. Optimize with REoptimizer®. See what REoptimizer® can unlock across your portfolio. Learn More
Learn More
FAQs: Triple Net Leases, Building Age, and OPEX Volatility
What is a triple net (NNN) lease?
A triple net lease is a commercial lease structure where the tenant pays base rent plus operating expenses, typically including property taxes, insurance, and maintenance/CAM. It’s common in industrial, flex, retail, and single-tenant assets.
What does “OPEX” mean in commercial real estate?
OPEX (operating expenses) refers to the ongoing costs to operate a property, such as maintenance, repairs, common area maintenance (CAM), utilities (often), property management, and other pass-through charges, depending on lease language.
Why can OPEX matter more than rent in an NNN lease?
Because rent is usually fixed or escalates predictably, while taxes, insurance, and maintenance can fluctuate significantly. Over time, OPEX volatility can raise your effective occupancy cost enough to outweigh a “good” rent rate.
How does building age increase NNN lease risk?
Older buildings typically have:
-
More frequent repairs
-
Less efficient systems (HVAC, lighting, insulation)
-
Components closer to end of life (roof, paving, electrical)
This results in higher maintenance spend and a greater likelihood of mid-term cost spikes, not just renewal-driven increases.
What is CAM, and how is it different from OPEX?
CAM (common area maintenance) usually refers to shared-area costs in multi-tenant properties, including:
-
Parking lots
-
Landscaping
-
Snow removal
-
Exterior lighting
OPEX is broader and may include CAM plus other operating costs, depending on how the lease defines pass-through expenses.
What are the biggest hidden cost drivers in an NNN lease?
Most surprises come from:
-
Tax reassessments and mill rate changes
-
Insurance premium increases driven by market shifts, risk exposure, or asset condition
-
Maintenance and repair escalation, especially in older assets
-
Unclear responsibility for capital replacement versus routine maintenance
What’s the difference between maintenance and capital replacement?
-
Maintenance: routine service and repairs that keep systems operating, such as filters, minor fixes, and patchwork
-
Capital replacement: replacing major components like roofs, HVAC units, paving, or structural systems
Lease language should clearly define responsibility, as this distinction often determines whether costs remain manageable or escalate rapidly.
Can a landlord push capital costs to a tenant in an NNN lease?
If the lease is vague, yes—especially in older properties. Clear definitions separating repair from replacement and operating costs from capital costs are critical to limiting exposure.
How do I evaluate the real cost of an NNN lease?
Use total cost of occupancy (TCO) modeling across the lease term, including:
-
Base rent
-
Property taxes and reassessment trends
-
Insurance volatility assumptions
-
Age-based maintenance curves
-
Energy and utility impacts if utilities are tenant-paid
What should I request before signing an NNN lease?
Ask for:
-
Three or more years of CAM and OPEX history with line-item detail
-
Recent property tax bills and assessment history
-
Insurance claims history and current premiums
-
Roof and HVAC age, service records, and estimated remaining life
-
Vendor contracts tied to pass-through charges
What lease clauses reduce OPEX volatility?
Common protections include:
-
Detailed CAM statement requirements
-
Audit rights and dispute windows
-
Exclusions for landlord overhead or undefined administrative fees
-
Clear capital replacement responsibility and amortization rules
-
Spending approval thresholds for major repairs
Are NNN leases always a bad deal for tenants?
No. NNN leases can be advantageous for tenants with strong operational discipline because they allow:
-
Competitive vendor bidding
-
Preventive maintenance optimization
-
Energy efficiency and retrofit strategies
Without portfolio-level visibility, however, the cost volatility remains with the tenant.
How can tenants reduce OPEX in older industrial buildings?
High-impact strategies include:
-
Preventive maintenance scheduling, especially for HVAC and roof systems
-
LED lighting and controls retrofits
-
Sealing and insulation improvements
-
Vendor consolidation and standardized scopes of work
-
Portfolio-wide CAM and OPEX audits
What’s the simplest red flag that an older NNN building will get expensive?
A combination of:
-
Below-market base rent
-
Limited building documentation
-
Aging roof and HVAC systems near end of life
-
Vague lease language around maintenance and capital replacement
How does REoptimizer® help with NNN lease management?
REoptimizer® helps occupiers turn occupancy cost into structured intelligence by enabling:
-
Portfolio-wide OPEX trend tracking
-
Anomaly detection and audit readiness
-
Lifecycle exposure modeling tied to asset age
-
Data-driven renewal versus relocation decisions
Rent escalations aren’t inherently “bad.” They’re a normal part of commercial leasing meant to protect a landlord’s revenue over time. The real risk is how the escalation is structured—and how easily the language can shift volatility, compounding, and index-selection power onto the tenant.
This is why escalation clauses are one of the most common “quiet cost drivers” in a lease: the numbers often look acceptable in Year 1, but the clause can create an outsized impact by Year 7, 10, or 15. Let’s talk about how to avoid this.
What Is A Rent Escalation Clause?
A rent escalation clause defines how rent increases over the lease term, including timing (annual, every other year, at specific milestones) and the method used (index-based, fixed, hybrid, or bumps). The nuance most teams miss is that escalations are typically compounding: each increase builds on the last year’s rent, not the original base. That compounding effect is where “small” differences in language become meaningful portfolio-level budget outcomes.
Two subtle points that matter in negotiations:
-
Escalation method interacts with term length. A clause that seems tolerable in a 5-year deal can become a serious exposure in a 12–15 year deal.
-
Escalation language often includes embedded leverage. Index selection, floor/ceiling language, notice timing, and calculation method can all tilt results—without changing the headline escalation “type.”
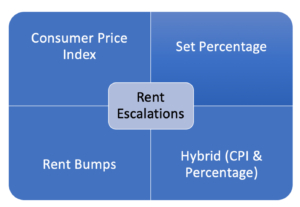
The Four Basic Types Of Rent Escalations
1. CPI Or Inflation-Based Escalations
CPI-based escalations are often presented as “fair”—rent only rises with inflation. But the practical reality is that CPI clauses can be one-sided risk transfer if they don’t include guardrails.
Where CPI gets dangerous (the nuance):
-
Index selection isn’t neutral. Landlords may specify a CPI measure or geography that best supports higher increases. Even small differences in index definition can create materially different outcomes over time.
-
CPI clauses can have “silent” floors. Some CPI clauses include a minimum increase (a floor) even when CPI is low, but still allow full upside when CPI is high. That’s not “inflation protection”—that’s asymmetry.
-
Timing matters more than most people think. CPI is usually measured over a period (e.g., year-over-year). If the clause uses a measurement window that catches an inflation spike, that spike can become embedded in the rent base going forward.
-
Compounding locks in the pain. Even if inflation cools later, the higher rent established during the spike becomes the new baseline for future increases.
How REoptimizer® helps (subtle but powerful):
-
Flags CPI escalation language and the fine print (index, geography, lookback window, floor/ceiling language)
-
Converts the clause into a plain-English summary: “Your rent increases by X, measured by Y, calculated on Z schedule, with limits of A/B”
-
Models multiple inflation scenarios so you can see how “reasonable” becomes “runaway” across the term, especially in longer leases
Negotiation angle that often works:
If CPI is on the table, push for caps and clarity (and avoid floors that create upside-only outcomes). When landlords insist on CPI, the win is often in the guardrails—not in eliminating CPI entirely.

2. Fixed Percentage Escalations
Fixed escalations are typically the most tenant-friendly option because they turn uncertainty into a schedule. But “fixed” doesn’t automatically mean “optimized”—the details still matter.
The nuance in fixed escalations:
-
Fixed is predictable, not always cheap. A fixed 3% may be a win versus CPI during high inflation—but in low-inflation periods it can cost more than what CPI would have done. The key is whether the predictability premium is worth it for your organization.
-
The compounding effect is still real. A fixed increase compounds too, so the difference between 2.5% and 3% is not linear over 10+ years.
-
Fixed escalations can hide in base rent resets. Some leases combine a fixed escalation with periodic “reset to market” language or appraisal mechanisms that function like a second escalation.
-
Fixed increases interact with concessions. A landlord may trade a slightly lower fixed escalation for changes elsewhere (free rent, TI, abatement language, operating expense treatment). The “best deal” is often the one with the best total economics, not the lowest escalation percentage.
Negotiation angle that often works:
Fixed escalations are easiest to justify internally. They also make it easier to create landlord competition because you can compare offers apples-to-apples across properties.
3. Hybrid Escalations (Fixed + CPI Triggers Or Limits)
Hybrid systems are where complexity starts doing real damage—or real good—depending on how they’re structured. A well-built hybrid can be a smart compromise in long-term deals. A poorly built hybrid can quietly recreate CPI risk while looking tenant-friendly.
The nuance in hybrids:
-
Hybrids should reduce volatility, not reintroduce it. The goal is a controlled range of outcomes. If a hybrid clause still allows large CPI swings with minimal limits, it’s not really a hybrid—it’s CPI with extra steps.
-
Trigger design is everything. A “trigger” could be CPI above a threshold, but you need to examine:
-
What measurement period is used?
-
What happens when CPI goes back down?
-
Does the escalation revert, or does it ratchet upward permanently?
-
Caps/floors can create asymmetry. A ceiling (cap) helps tenants. A floor helps landlords. Some hybrids include both—fine—unless the floor is set high and the cap is set too high to matter.
-
Hybrids can be structured as “bands.” For example: 3% unless CPI exceeds X, then 4% for that year only, then revert when CPI normalizes. That approach contains exposure better than “CPI in full if CPI exceeds X.”
Negotiation angle that often works:
Hybrids are a useful concession when landlords won’t commit to fixed increases across long terms. The tenant win is getting the hybrid to behave like a fixed schedule most years while limiting worst-case inflation exposure.
4. Rent Bumps (Set Dollar Increases)
Rent bumps are often viewed as simple, but they can carry their own nuance—especially in how frequently they occur and how they align to market dynamics.
The nuance in rent bumps:
-
Bumps can be more transparent than percentages. Stakeholders can understand “+$0.50/SF” more quickly than compounding percentages—useful for approvals and budgeting.
-
Frequency is negotiable in some markets. Annual bumps are common, but every-other-year bumps can appear when demand is lower or when landlords are trying to stabilize occupancy.
-
Bumps behave differently depending on the starting rent. A $1.00/SF bump is a larger effective percentage when starting rent is low and a smaller effective percentage when starting rent is high. That matters when comparing proposals.
-
Bumps can be paired with renewal options strategically. Tenants can sometimes negotiate different bump schedules for base term vs. renewal periods, aligning increases to business uncertainty.
Negotiation angle that often works:
If you can’t win on the bump amount, win on the timing (less frequent increases) or on other economic levers that reduce total occupancy cost.
Why CPI Escalations Tend To Be The Most Dangerous
CPI escalations feel reasonable because they’re anchored to “inflation,” which sounds objective. But CPI clauses are often where landlords can embed the most optionality and the least predictability for tenants. The biggest tenant-side risk isn’t CPI itself—it’s CPI without boundaries, combined with compounding.
REoptimizer® helps teams avoid the classic mistake: evaluating escalation clauses based on what inflation has been, rather than what it could be over the life of the lease.

How To Negotiate A More Tenant-Friendly Escalation
A strong escalation strategy typically looks like this:
-
Start with a fixed schedule preference (predictability wins internal buy-in)
-
If CPI enters the deal, contain it with clear caps and transparent definitions
-
Avoid one-way clauses (floors without meaningful caps, or ratchets that never revert)
-
Use competition to force landlords to price risk fairly
REoptimizer® supports this by turning lease language into a financial narrative: what you’re paying, when you’re paying it, and what could change under different conditions—so the negotiation isn’t emotional, it’s mathematical.
REoptimizer® Use Cases For Escalation Clauses
-
Clause Risk Flagging: Identify CPI, ratchets, floors, and hybrid triggers early—before late-stage legal review.
-
Scenario Modeling: Test inflation environments so teams can see exposure boundaries, not just the “expected” path.
-
Budget-Ready Rent Schedules: Generate stakeholder-friendly schedules that align to term, options, and renewal structure.
-
Negotiation Prep: Quantify alternatives so you can trade intelligently (e.g., escalation concessions in exchange for TI, free rent, or better renewal terms).
Schedule a demo today to see hoe REoptimizer® can level up your portfolio by strengthening each individual lease.
Book a Demo
FAQ’s Rent Escalation:
Which rent escalation is safest for tenants?
Most tenants prefer 2. Fixed Percentage Escalations because predictability reduces budget risk and approval friction.
Why can CPI escalations become expensive even if inflation falls later?
Because rent is usually compounding. A high CPI year can increase the base rent permanently, and subsequent increases build on that higher number.
Are hybrid escalations good or bad?
3Hybrids can be good when they genuinely limit volatility (caps, bands, reversion). They’re risky when they add complexity without adding real limits.
Are rent bumps better than fixed percentages?
Rent Bumps can be excellent for transparency and, in some cases, negotiable frequency. The “better” option depends on starting rent, bump size, and term length.
Commercial lease renewals are no longer a routine administrative task. In today’s office market, they are one of the most powerful—and underutilized—levers for reducing occupancy costs, improving space utilization, and reshaping a company’s real estate portfolio.
Done strategically, a renewal can unlock millions in savings, flexibility, and optionality. Done passively, it can quietly lock in outdated economics, underused space, and unnecessary risk for years.
This guide explains how to approach commercial lease renewals—and how modern portfolio intelligence tools like REoptimizer® allow tenants to make renewal decisions with clarity, leverage, and confidence.
What Is A Commercial Lease Renewal?
A commercial lease renewal is the process of extending, renegotiating, or restructuring an existing office lease before its expiration. While many leases include renewal options, exercising them without market analysis can be one of the most expensive mistakes tenants make.
A renewal should be treated as a new transaction, evaluated against current market conditions, space utilization, and long-term business strategy—not as a default continuation of the past.
Why Commercial Lease Renewals Matter Right Now
The office market didn’t just “bounce” into a new cycle—it repriced risk and value. That shows up in how landlords underwrite deals, how employees experience offices, and how finance teams judge real estate decisions.
-
Hybrid Work Changed Utilization, Not Just Attendance
It’s not simply “fewer days in-office.” It’s spikier demand (peaks midweek, valleys Monday/Friday), more cross-functional collaboration days, and greater sensitivity to layout quality. Two companies can have the same headcount and radically different space needs depending on scheduling norms, team structure, and meeting behavior.
-
Vacancy Is Elevated, But Leverage Is Uneven
Many submarkets have plenty of availability, yet best-in-class buildings can still command stronger pricing and terms because they’re winning the “flight to quality.” That means renewals aren’t about “rent down” everywhere—they’re about choosing whether you’re paying for quality, flexibility, or pure cost, and negotiating accordingly.
-
The Real Gap Is Between “Contracted Rent” And “Market Reality”
A lot of tenants are sitting in leases negotiated under very different assumptions—growth projections, in-office expectations, and rent trajectories. Even when face rent looks acceptable, the total economics can drift: escalations compound, operating expenses rise, and older leases often lack modern flexibility (givebacks, expansion rights, sublease freedom, termination options).
-
Capital Markets And Building Health Now Matter To Tenants
Lease decisions used to be mostly about space and price. Now, tenants also have to think about landlord capacity to fund improvements, maintain services, and execute capital work. Building-level financial stress can translate into operational friction—or become leverage if you understand the owner’s incentives and timing.
-
Costs To Move Or Build Out Are Higher And More Variable
The renewal vs. relocate math isn’t just about rent. It’s about TI dollars, construction timelines, permitting risk, downtime, furniture/IT, and change management. In many cases, the “cheapest rent” option loses once you model the full cost and risk to execute.
-
Leadership Teams Want Finance-Grade Decisions
CFOs and executives increasingly expect real estate choices to be justified like any other investment: NPV impact, scenario planning, risk tradeoffs, and measurable utilization—not anecdotes like “people like the building.” That’s why the renewal window is so valuable: it’s one of the few times you can make a high-impact change with a clear decision point and negotiation leverage.
Net: the renewal window is one of the only moments where tenants can reset economics, right-size intelligently (not blindly), and rebalance portfolios—but only if they have visibility into things like remaining lease NPV, true utilization by site, comparable deal terms, and relocation scenarios (exactly the inputs tools like REoptimizer® are built to centralize).

The Four Most Common Commercial Lease Renewal Mistakes
1. Treating A Renewal Like A Paperwork Exercise
Tenants often assume that staying put is the safest option. Familiarity with the space, landlord, and commute patterns can create a false sense of security.
But renewing without analysis often means:
-
Overpaying above market rent
-
Carrying excess or poorly configured space
-
Locking into outdated lease terms and escalations
A renewal is a multi-year financial commitment and should receive the same scrutiny as a new lease—sometimes more.
2. Negotiating Without Understanding True Portfolio Economics
Many tenants negotiate renewals in isolation, looking only at:
-
Current rent
-
Renewal option language
-
Short-term savings
What’s often missing is visibility into how each lease performs inside the broader portfolio.This is where modern portfolio analytics change the game.With REoptimizer®, tenants can:
-
See the remaining Net Present Value (NPV) of each lease
-
Understand how future rent escalations compound over time
-
Compare the cost of staying versus relocating or restructuring
-
Identify which locations are financial outliers
Without this data, tenants negotiate blind.
3. Ignoring Utilization And Right-Sizing Opportunities
Excess space is one of the largest hidden costs in corporate real estate.
Many organizations no longer need the same footprint they signed for years ago—but that doesn’t always mean a simple reduction. The real opportunity lies in nuanced optimization. REoptimizer® enables tenants to:
-
Measure utilization at each site
-
Identify underused locations and redundant footprints
-
Evaluate whether satellite offices can be consolidated
-
Model scenarios like combining locations into a single, higher-quality hub
Instead of asking, “How much space do we cut?” The better question is, “How should our space actually work?”
4. Failing To Leverage The Market With Real Alternatives
Landlords negotiate differently when they know a tenant has credible options.
However, “alternatives” only create leverage if they are:
-
Comparable in quality and function
-
Priced accurately on a net-effective basis
-
Evaluated alongside renewal economics
REoptimizer® allows tenants to:
-
Match renewal terms against true market comparables
-
Compare new locations side-by-side with the existing lease
-
Model total occupancy costs across multiple scenarios
-
Create defensible competition for their tenancy
This transforms negotiations from reactive to strategic.

How REoptimizer® Changes The Commercial Lease Renewal Process
Traditional renewal planning relies on spreadsheets, fragmented data, and anecdotal market knowledge. REoptimizer® replaces that with a centralized decision platform.
Portfolio-Level Intelligence
Utilization And Strategy Alignment
-
Site-level utilization insights
-
Identification of consolidation and combination opportunities
-
Alignment with hybrid work policies and growth plans
Market And Scenario Comparison
-
Comparable lease benchmarking
-
Renewal vs. relocation modeling
-
Side-by-side evaluation of multiple options
Faster, Better Decisions
-
Clear visuals for executives and finance teams
-
Scenario modeling that supports internal buy-in
-
Data-backed negotiation strategies
The result: better outcomes with less guesswork.
When Should You Start Planning A Commercial Lease Renewal?
For most office tenants, renewal planning should begin 18–36 months before lease expiration, depending on portfolio size and complexity.
Starting early allows tenants to:
-
Identify leverage well before deadlines
-
Avoid costly extensions or rushed decisions
-
Use time as a negotiating advantage
-
Align real estate decisions with broader business planning
With tools like REoptimizer®, early planning becomes practical—not overwhelming.
The Bottom Line: Renewals Are Where Portfolios Are Won Or Lost
Commercial lease renewals are no longer about simply staying or leaving. They are about optimizing an entire portfolio—financially, operationally, and strategically.
Tenants who succeed will:
-
Treat renewals as new investments
-
Use data, not assumptions
-
Understand utilization at a granular level
-
Leverage market alternatives intelligently
-
Equip themselves with the right technology and representation
REoptimizer® doesn’t replace strategy—it enables it.Want to see how it can level up your portfolio? Book a demo today.
Book a Demo
Commercial Lease Renewal FAQs
When Should I Start Planning A Commercial Lease Renewal?
Most tenants should begin planning 18–36 months before lease expiration. Starting early gives you time to benchmark the market, build internal alignment, and create real negotiating leverage—without risking costly extensions or rushed decisions.
Should I Exercise My Renewal Option Or Renegotiate?
A renewal option is not automatically the “best deal.” Many option clauses reset only some terms (or lock in above-market economics). The safest approach is to price the option against market comparables and alternative locations, then choose the path with the best net-effective outcome.
How Do I Know If I’m Overpaying Rent?
You’re likely overpaying if your lease was signed in a stronger market and has compounding escalations, or if comparable buildings are offering better economics (rent, concessions, flexibility). The most reliable test is a true side-by-side comparison of:
-
Base rent + escalations
-
Operating expenses (and caps)
-
Tenant improvement allowance
-
Free rent / abatement
-
Move, build-out, and downtime costs
What Are The Biggest Negotiation Levers In A Lease Renewal?
Most renewal wins come from negotiating the full value stack, not just rent:
-
Tenant improvement (TI) dollars
-
Free rent / rent abatement
-
Operating expense protections (caps, exclusions, audit rights)
-
Flexibility clauses (expansion, contraction, termination options)
-
Parking, signage, and amenities
-
Sublease and assignment rights
Can I Reduce My Square Footage During A Renewal?
Often, yes—but it depends on building layout, the landlord’s leasing strategy, and timing. Many tenants pursue:
-
A direct reduction (smaller suite)
-
A re-stack within the building
-
A blend-and-extend with resizing
-
A partial giveback paired with a longer term
The key is to make the new footprint worth it to the landlord (term, credit, stability, or avoided vacancy risk).
How Do I Measure Office Utilization Before A Renewal?
Utilization should reflect how people actually use the space—by day, department, and peak periods—rather than assumptions. Measuring utilization helps you avoid renewing excess space and can reveal opportunities like consolidating teams, redesigning layouts, or combining nearby satellite locations.
What Is Remaining Lease NPV And Why Does It Matter?
Remaining lease NPV (Net Present Value) estimates the value of your remaining lease obligations in today’s dollars. It helps decision-makers compare options like:
-
Renewing vs. relocating
-
Downsizing vs. reconfiguring
-
Shorter term vs. longer term
-
Paying more now vs. avoiding higher long-term cost
NPV makes “stay vs. go” a finance-grade comparison instead of a gut call.
How Can REoptimizer® Help With Lease Renewals?
REoptimizer® helps tenants turn renewals into a portfolio optimization decision by enabling you to:
-
See the remaining NPV of each lease
-
Understand escalation exposure and term risk
-
View utilization by site to identify right-sizing opportunities
-
Spot nuanced consolidation plays (like combining satellite locations)
-
Match market comparables and benchmark deal terms
-
Compare renewal vs. new location scenarios side-by-side
How Do I Create Leverage In A Renewal Negotiation?
Leverage comes from credible alternatives and a clear plan. The best path is to:
-
Identify 2–4 realistic relocation options
-
Compare them against the renewal on a net-effective basis
-
Communicate that you can execute (not just “shop around”)
-
Keep options alive until the renewal is fully documented
Do I Need A Tenant Representative For A Renewal?
It’s not required, but it’s often the difference between an average deal and an optimized one. A tenant rep brings:
-
Market benchmarks and comp visibility
-
Negotiation strategy and leverage building
-
Term and legal-risk awareness
-
Time savings and process control
What If I Wait Too Long To Start The Renewal Process?
If you wait, you risk:
-
Losing renewal rights or negotiation windows
-
Paying for expensive short-term extensions
-
Accepting unfavorable terms due to time pressure
-
Missing better market opportunities
Time is leverage—starting early protects it.
In a year that once again tested expectations across commercial real estate, 2025 emerged not as a dramatic turnaround story but as a strategic inflection point—particularly for office and industrial sectors.
For corporate tenants and CRE teams navigating hybrid work, supply chain shifts, and capital market stress, the data tell a clear story: performance now hinges on precision, not prediction.
1. Office Market: Stabilizing — But Still Reshaping Demand
After years of pandemic-era contraction, the U.S. office market showed meaningful signs of stabilization in 2025—even if the recovery remains uneven and deeply contextual.
Attendance Patterns Point to Growing Stability
Office traffic has steadily climbed throughout the year, with national office attendance approaching 72.6% of pre-COVID levels in 2025 according to foot-traffic analytics. This marks a dramatic increase from the pandemic troughs and represents one of the strongest rebounds since 2020.

These attendance gains have real economic implications. Not only do they support stabilization in rental dynamics and tenant confidence, but they also provide the workforce presence necessary to justify continued investment in office space, amenities, and hybrid collaboration zones.
Additionally, the proportion of corporations actively tracking attendance jumped to 69%, reflecting a growing recognition that employee attendance data are not just operational but strategic for measuring impact on productivity, utilization, and tenant experience.
Vacancy Remains High, But Market Fundamentals Are Improving
Office vacancy, though elevated compared to historical norms, edged slightly lower in 2025. National vacancy hovered around 18.6% in late 2025, a modest dive relative to the record highs it experienced through 2023–24.
In major gateway markets like New York City, vacancy pressure is easing. Moody’s data show that while vacancy rates remain above long-term averages, net absorption turned marginally positive in 2025, a sign that employers with clear hybrid strategies are contributing to localized demand growth.
Meanwhile, leasing activity in key submarkets underscored renewed confidence. Downtown Manhattan saw vacancy fall to 23% with average asking rents rising by over 3% year-over-year—a strong performance relative to broader national trends.
Flight to Quality Persists
Vacancy is no longer a single market condition—it’s a two-tier outcome tied to asset quality. And the 18.6% average vacancy can be misleading when we look at it as a whole. The more important story for occupiers is the duality inside that number.
The office market isn’t recovering uniformly; it’s splitting by asset quality and by submarket, creating a widening performance gap between buildings that can win talent back (and justify on-site days) and those that can’t.
Across major markets, leasing activity continues to tilt toward Trophy/Class A, while Class B/C’s share shrinks—a pattern that effectively pulls fundamentals upward for the best assets while leaving commodity stock behind.
Manhattan is one of the clearest examples of this duality: Trophy properties captured 61.6% of Manhattan leasing activity in Q1 2025 (by class), an unusually concentrated signal that tenants are choosing “best-in-market” space even when overall demand is still recovering.
Why This Matters For Corporate Tenants
Flight to quality is often framed as a landlord story. For occupiers, it’s a portfolio performance lever:
- Trophy/Class A is becoming the “utilization bet.” If your workplace strategy relies on consistent in-office patterns to drive collaboration and culture, premium assets increasingly act like the infrastructure that makes that behavior easier to sustain.
- Class B/C is becoming a repositioning / pricing bet. There can be value, but the underwriting has to assume higher volatility and larger gaps between “leased” and “used” space—plus greater reliance on concessions and landlord capex to stay relevant. (This is why conversion/repositioning talk keeps rising in market reports.) Not to mention a lot of these assets are being phased out of the market completely as conversions take shape.

2. Industrial: Continued Demand, With Nuanced Supply Dynamics
Industrial real estate sustained its long run of relative strength in 2025, even as supply and demand shifted toward equilibrium.
Long-Term Occupancy Growth Is Unbroken
Industrial tenant demand remained positive for the 60th consecutive quarter, a streak that now spans nearly 15 years—a testament to structural drivers such as e-commerce logistics and manufacturing rebalancing.
However, industrial vacancy did tick higher, reaching around 7.3% in Q2 2025, as move-outs and completions both contributed to slight softening.
Rent Growth Moderates, but Demand Diversity Expands
Industrial rent growth softened compared to the rapid gains of the pandemic era.
That said, diversification within the sector—especially toward cold storage, last-mile logistics, and automation-ready assets—continues to support strategic leasing and long-term tenant retention.
For tenants, this trend underscores the increasing importance of site selection analytics that match inventory with evolving supply chain footprints rather than broad assumptions of generalized growth.
The Construction Pipeline: Why Rent Growth Didn’t Collapse
That demand diversification is landing at the exact moment the industrial pipeline is drying up—which is a big reason rent growth moderated instead of falling off a cliff.
- Space under construction fell ~61% from the 2022 peak, dropping to ~279M SF in Q1 2025, with forecasts calling for the pipeline to dip below 250M SF by year-end.
- At the start of 2025, nationwide industrial construction was already down ~25% year-over-year, signaling a clear pullback in new supply.
The supply picture also explains the “two-speed” industrial market corporate tenants are feeling: vacancy rose to ~7.1% nationally in Q2 2025, yet small warehouses (<100K SF) stayed tight at ~4.4% vacancy—exactly the segment most aligned with last-mile and serviceable infill demand.
Net: 2025’s pipeline reset is quietly supporting pricing power in the right product types—especially smaller, well-located, higher-spec space—while pushing tenants toward sharper site selection analytics to avoid being trapped between soft big-box supply and scarce infill options.
3. Capital Markets and CRE Valuations: Discipline and Divergence
2025’s capital markets landscape accentuated a central reality: value is emerging at the intersection of risk management and operational data.
- Persistent headwinds in office valuations continued, with commercial property values still well below pre-pandemic levels in many categories.
- Conversely, industrial and select retail assets maintained relative valuation resilience due to consistent demand fundamentals and niche structural drivers.
For CRE teams, this divergence is a reminder that portfolio performance is not monolithic. Markets like Sun Belt logistics hubs and high-amenity urban cores are commanding differentiated risk premiums based on robust utilization and tenant demand clarity.

4. CRE Tech & Analytics: A Strategic Imperative
Perhaps the most pervasive trend of 2025 is the integration of advanced analytics, automation, and real-time occupancy intelligence into every layer of CRE decision-making.
From attendance tracking that informs space allocation and workplace strategy to predictive models that anticipate lease expirations and submarket pricing shifts, CRE technology is now a core operational competency—not a novelty.
This evolution reflects a broader shift from reactive portfolio maintenance to strategic portfolio optimization powered by reliable, real-time data.
And no where is the promise of real time data more profonde than the emergence of AI. It’s really the elephant in the room when we talk about the trends that have taken shape in 2025.
A Global Real Estate Technology Survey captures the moment bluntly: ~90% of organizations are piloting AI, yet only ~5% report achieving all (or most) of their AI goals—a gap that signals both massive momentum and a lot of wasted spend if the data foundation isn’t ready.

What AI Changes For Corporate Tenants And CRE Teams
AI isn’t just making reporting faster. It’s starting to rewire how portfolios are run:
- From static planning to continuous optimization: AI-enabled platforms can blend utilization, lease terms, operating costs, and market data to surface opportunities in near-real time (not quarterly).
- From “attendance” to predictive operations: The next step after occupancy dashboards is AI that flags leading indicators—teams drifting off hybrid norms, sites with creeping underutilization, rising overtime exposure, or policy exceptions that create compliance risk—early enough to intervene.
- From workflow automation to measurable efficiency: Morgan Stanley Research estimates AI could drive $34B in efficiency gains for the real estate industry over the next five years (through 2030) by automating tasks and improving productivity—exactly the kind of savings corporate occupiers will expect their CRE orgs to capture.
Right now, companies are pouring billions of dollars into the development of AI technology. For now, we’re in a bit of a watch and wait mode to understand how its full potential will affect workforce dynamics. But not to mention, it stands ready to slash hundreds of thousands of jobs.
Looking Ahead: 2026 and Beyond
As we close the books on 2025, a few imperatives emerge for corporate tenants and CRE teams:
- Measure utilization meaningfully: Moving beyond nominal occupancy figures to correlated productivity and performance metrics will define competitive advantage.
- Anticipate hybrid dynamics: The office is no longer “either dead or alive”; it is a flexible, culture-dependent asset whose value must be quantified, not assumed.
- Diversify CRE strategy by sector insight: Industrial dynamics will continue to strengthen, but their performance will be location and use-case specific.
- Embed analytics in every decision: From attendance data to portfolio repositioning, advanced data platforms are no longer optional—they are essential.
2025 wasn’t a year of simple narratives. It was one defined by data-informed nuance, measured progress, and strategic recalibration. For forward-thinking tenants and CRE professionals, the lesson is unmistakable: precision beats prediction.
Turn Insight Into Action With REoptimizer®
If precision beats prediction, then 2026 belongs to the teams that can see their portfolios clearly—and act faster than the market.
REoptimizer® gives corporate tenants a single, decision-ready view of performance across office and industrial portfolios, connecting utilization, attendance, market dynamics, and workforce signals into one strategic platform. Instead of reacting to headlines or relying on averages, CRE teams can identify what’s working, what’s at risk, and where to optimize—before costs, compliance, or underutilization compound.
With REoptimizer®, you can:
-
Measure real utilization—not just leased space
-
Align hybrid strategy with actual attendance and productivity signals
-
Compare asset performance across markets, building types, and use cases
-
Surface risks and opportunities early, using reliable, real-time data
The next CRE cycle won’t be managed quarterly—it will be optimized continuously.
See how leading corporate tenants are using REoptimizer® to turn insight into advantage.
👉 Book a demo and get a portfolio-level view of what your data is already telling you about 2026.
Book a Demo
November 2025 delivered the strongest November office occupancy since 2019 when measured by average visits per working day, even though total visits remain below pre-pandemic levels. In other words: office attendance is rising, but it’s rising unevenly—and the “headline” number can be misleading if you don’t normalize for working days.
For corporate tenants managing large-scale portfolios, that distinction matters. Because when you’re making lease, space-planning, and operating decisions across multiple markets, you’re ultimately trying to answer a simple question:
Are we getting the physical presence we’re paying for—and is it improving team productivity and business operations?
This is where attendance tracking, workforce analytics platform capabilities, and disciplined employee attendance management separate reactive portfolio management from proactive strategy.

Why “Visits” Aren’t Enough For Corporate Tenants
Placer.ai’s index can tell you how buildings are being used at the market level. But inside an enterprise portfolio, you need accurate attendance intelligence that connects:
- Employee attendance and attendance patterns by site, day, and team
- Time and attendance and employee hours for operational planning
- Productivity metrics and outcomes (not just bodies in seats)
- Compliance with labor laws, especially for non exempt employees
- Labor costs, including monitor overtime controls and scheduling waste
The gap between “the city is recovering” and “our portfolio is performing” is often just one thing: reliable, decision-grade attendance records and accurate records you can trust.
The New Reality: Market-Level Office Attendance Is Diverging
The November 2025 story is not a single national narrative—it’s a set of local stories that impact tenant strategy.
Sun Belt Momentum And Commute Dynamics
Miami maintained its lead in the office recovery and widened the gap versus New York, supported by corporate relocations and commute dynamics.
Weather, Transit, And Attendance Softness
New York saw attendance ease, with seasonal weather and transit-heavy commutes weighing on in-office days.

Tech Markets Showing Real Rebound Signals
San Francisco recorded some of the strongest year-over-year gains, signaling a meaningful turnaround, with other tech-influenced markets (Denver, Chicago, Boston) also improving—while still below pre-pandemic levels.
Policy And Local Economics Still Create Downside Risk
Houston and Washington, D.C. posted year-over-year declines tied to local industry/policy headwinds, including shutdown spillover. For tenants, this widening divergence means you should stop assuming one return-to-office playbook works everywhere. The portfolio winners will be the ones who can measure attendance precisely, then adapt site strategy accordingly.
From Counting Heads To Managing Risk: Attendance Monitoring As A Control System
In large portfolios, tracking employee attendance isn’t just an HR function—it’s risk management. Weak attendance monitoring can create:
- Compliance issues and compliance risks (meal/rest rules, overtime, scheduling documentation)
- Payroll errors and payroll mistakes caused by bad time capture
- Time theft and buddy punching when systems rely on unchecked manual inputs
- Higher employee absenteeism, poor attendance, and lost productivity
- Inconsistent treatment that can trigger disputes or disciplinary action risk
If you’re still relying on manual systems (spreadsheets, ad hoc badge checks, manager estimates), you’re not just missing insight—you’re increasing operational exposure.
What A Modern Attendance Solutions Stack Looks Like
Corporate tenants increasingly need attendance solutions that unify workplace utilization with employee time controls—without turning the office into a surveillance zone.
A pragmatic enterprise approach usually includes:
1) Employee Attendance Software That Produces Reliable Data
Look for employee attendance software and attendance software that supports:
- Real time tracking and real time attendance
- Automated systems for clock-ins, exceptions, and approvals
- Comprehensive reports for leaders and hr teams
- Clean integrations for payroll processing and time off requests
- Auditable employee attendance records and attendance records
2) Time Tracking That Matches How People Actually Work
In hybrid reality, you need time tracking that can:
- Track time for remote employees and remote workers
- Support flexible schedules and modern work patterns
- Help monitor overtime without punishing legitimate flexibility
- Provide valuable insights into staffing, not micromanagement

3) Optional Stronger Identity Controls Where Risk Requires It
In certain environments (high-security, regulated, or high time-theft exposure), organizations may consider:
- Biometric time clocks
- Facial recognition
- Secure on-site check in workflows: These can reduce security risk, prevent buddy punching, and improve the integrity of employees clock events—but should be deployed with clear purpose, transparency, and policy governance to protect a positive work environment.
Portfolio Use Cases That Actually Move The Needle
Here’s how tenants use attendance monitoring and analytics to improve outcomes (without “cramming” a mandate everywhere):
Space Planning And Lease Strategy
Use attendance data to identify underutilized sites, then right-size footprints, adjust amenity investment, or renegotiate renewal terms based on real demand.
Team Collaboration And In-Office Design
If your goal is better team collaboration, don’t guess. Compare attendance patterns to meeting density and project milestones. Design on-site days around collaboration, not routine solo work.
Productivity And Cost Control
Tie employee productivity and team productivity to a small set of measurable signals:
- Focus time vs. meeting time
- Cycle times and throughput
- Productivity metrics by team and site: Then decide where “in office” truly improves outcomes—and where remote execution is more effective.
Early Signs And Intervention
Use analytics to spot early signs of systemic issues: spikes in unplanned absences, schedule friction, approval bottlenecks, or manager-level inconsistencies. Pair this with wellness programs or workload adjustments before problems become attrition.
Maintain Compliance Without Killing Culture
Corporate tenants can ensure compliance and still support flexibility if they treat attendance as policy + systems + fairness:
- Document clear attendance policies and how exceptions work
- Configure rules by employee category (especially non exempt employees)
- Keep work hours and overtime logic consistent across locations
- Use systems to reduce disputes: auditable accurate records prevent “he said / she said”
When done well, managing attendance becomes a trust-building operating rhythm—not a morale drain.

Frequently Asked Questions About Employee Attendance Tracking
What’s The Difference Between Office Attendance And Employee Attendance?
Office attendance often measures building usage (visits), while employee attendance tracking focuses on who worked, where, and when—supporting scheduling, compliance, and payroll accuracy.
Why Do Corporate Tenants Need Attendance Tracking If They Have Access Control Data?
Badge swipes can indicate entry, but they often don’t produce compliant employee attendance records, don’t support time and attendance rules, and can miss hybrid patterns or onsite duration needed for operational decisions.
How Do We Monitor Attendance Without Micromanaging?
Focus on outcomes and exceptions. Use attendance monitoring to run business operations (staffing, space, compliance), not to scrutinize every minute. Make reporting transparent and limit access to role-based needs.
How Does Attendance Tracking Reduce Payroll Errors?
By automating capture and approvals, and integrating with payroll, you reduce manual edits, missed punches, and inconsistent rounding—common causes of payroll errors and payroll mistakes.
What Corporate Tenants Should Do Next With REoptimizer®
If you’re managing a large portfolio, the next phase of the office recovery isn’t about guessing—it’s about governing with data.
REoptimizer® helps corporate tenants:
- Create a single source of truth for employee time and attendance across every location—so leadership, HR teams, and operations are aligned.
- Replace manual systems with automated, reliable data that supports accurate records, fewer payroll errors, and stronger compliance.
- Track what matters in one portfolio view: real time attendance, overtime exposure, absence trends, and site utilization—so you can spot issues early and act fast.
- Use workforce insights to refine hybrid strategy so in-office time improves collaboration and team productivity—not just policy compliance.
Office attendance may be hitting post-pandemic highs, but portfolio advantage comes from what you do next. When markets diverge and every square foot has to justify itself, REoptimizer® turns attendance data into clear actions—so you can reduce risk, control labor costs, and optimize space with confidence.
Ready to see what your portfolio is really telling you? Request a REoptimizer® demo and get a portfolio-level attendance and utilization readout tailored to your footprint.
Book a Demo
If 2024–2025 was the “wait-and-see” phase, 2026 is shaping up as the execution window—not because risk disappears, but because financing and expectations are finally aligning enough to transact.
Pricing is more workable, capital is more available (still selective), and a large wave of debt maturities forces real decisions. The result: more motion, more restructuring, and more opportunities for buyers and operators who are prepared.
This isn’t a boom cycle. It’s a reset cycle—where disciplined underwriting and execution matter more than forecasts. Let’s discuss.
Capital Markets Are Re-Opening, But Discipline Is The Price Of Admission
The central trend for 2026 is liquidity with conditions. Deals don’t clear because someone feels optimistic; they clear because the structure makes sense under today’s financing and today’s cash flow.
Three things are pushing activity higher:
-
Debt Maturity Pressure: A meaningful volume of loans are coming due, and not every asset can refinance cleanly at current rates and lender standards. That creates recapitalizations, note sales, extensions, and motivated dispositions.
-
Bid-Ask Spreads Keep Tightening: As more owners accept where pricing is, transaction timelines shorten and deals become executable.
-
Structured Capital Stays Mainstream: Preferred equity, JV recapitalizations, partial sales, and creative lender solutions remain common because they bridge valuation and basis gaps.
Office Continues To Separate Winners From Losers
Office isn’t “back.” But it is becoming more investable—selectively. In 2026, the office market is less about a headline recovery and more about a clean reality: tenants are still leasing, but they’re choosing carefully. That means office performance is increasingly determined by building quality, location, and execution, not “the office sector” as a whole.
The Market Is Defined By Sorting
Buildings that win in 2026 tend to share a few traits:
-
Location and access that make commutes and client visits easy
-
Modern, efficient layouts (flexible floor plates, strong light lines, better circulation)
-
Natural light and comfort that materially improve day-to-day experience
-
Amenities that actually get used (not brochure bait)—conference capacity, food options, fitness, outdoor space
-
A credible tenant experience, meaning the building feels cared for and managed like a product
In practical terms: if a building makes it easier to recruit, retain, and collaborate, it stays in the consideration set.

Commodity And Obsolete Space Faces Hard Choices
On the other side of the market is space that’s functionally behind the times. And here’s the key 2026 dynamic:
Functional obsolescence turns into financial obsolescence fast.
When leasing slows, older buildings typically get hit twice:
-
Revenue pressure from weaker demand (and heavier concessions)
-
Capex pressure from what it takes to compete (lobbies, elevators, HVAC, bathrooms, common areas, spec suites)
That’s when owners end up facing the real decision tree:
-
Reposition (serious capex + a leasing plan)
-
Recapitalize (bring in equity, restructure the stack)
-
Convert (where zoning, economics, and floor plates allow)
-
Exit (sell at a basis the market will accept)
Drifting is expensive. In 2026, the penalty for indecision is usually higher than the penalty for taking a loss and moving on.
Concessions Drive The True Rent
A major reason office narratives get distorted is because people talk about asking rent when the market is being priced through concessions.In 2026, net effective rent is the truth serum.Many deals “work” on paper until you model:
-
Tenant improvements (TI) at current construction costs
-
Free rent
-
Downtime (and the carry cost of vacancy)
-
Leasing commissions
-
Operating expense leakage (especially in partially vacant buildings)
That’s why two buildings with the same asking rent can be worlds apart in actual performance.
What Strong Office Underwriting Looks Like In 2026
Model Net Effective Rent, Not Face Rent
Underwrite the actual deal terms tenants sign—not the number on the brochure. Net effective rent is where value is won or lost.
Treat TI / Free Rent / Downtime As Core Variables
These aren’t footnotes. They are the biggest swing factors in office returns right now. Underwrite them conservatively and stress test them harder than you think you need to.
Prioritize Assets With Simple Plans
The best office deals in 2026 aren’t the ones with the fanciest story. They’re the ones with the clearest path: upgrade → re-tenant → stabilize
If the plan needs perfect timing, perfect rates, and perfect leasing all at once, it’s not a plan—it’s a prayer.

Industrial Moves From Post-Supply Digestion To The Next Growth Phase
Industrial remains one of the cleanest demand stories in CRE, and 2026 looks like the year the sector works through the remaining supply bulge and resumes a steadier growth cadence. Industrial is appearing to finish absorbing the supply bulge and shift back into a healthier, steadier growth rhythm.
Demand Drivers Stay Intact (And They’re Not Going Away)
Logistics And 3PL Keep Expanding
Third-party logistics isn’t a trend—it’s how modern supply chains scale. As shippers push for faster delivery, better inventory positioning, and flexible capacity, 3PL demand keeps showing up in the leasing market. Industrial space is increasingly a service platform, and 3PLs are the operators behind it.
Supply Chain Redesign Creates Durable Space Demand
Companies are still redesigning networks for resilience: more regional distribution, more redundancy, less reliance on single points of failure. That translates into real estate needs that are sticky:

Manufacturing And Tech-Adjacent Uses Add Higher-Value Absorption
The strongest industrial pockets are pulling demand from users that care about power, labor, and throughput—not just rent. Advanced manufacturing, specialized assembly, and tech-adjacent operations can create longer-duration occupancy and better credit profiles when the location works.
The Constraint Investors Underweight: Infrastructure Capacity (Especially Power)
In 2026, industrial markets don’t compete only on location. They compete on deliverability.
Two sites can look identical on a map and perform completely differently in reality—because one can get power, approvals, and utility capacity on time, and the other can’t.
What “infrastructure wins” actually means:
-
Power availability (and realistic timelines to upgrade service)
-
Utility capacity for modern operations (HVAC loads, automation, cold chain, specialized equipment)
-
Speed to permit (municipal process and predictability)
-
Scalability (can the site support expansion or higher-intensity users later?)
The market is pricing speed and certainty. Tenants will pay for facilities that can be delivered on schedule and run reliably. Investors should too.
Data Centers Stay Demand-Led, But Power Becomes The Underwriting Battleground
Data centers continue to attract capital because demand is structural. But 2026 is not just about “more AI.” It’s about the bottlenecks that decide what can actually get built and leased.
The gating issues:
-
Power availability and delivery timelines
-
Interconnection and transmission limits
-
Permitting and community resistance in certain areas
-
Equipment and infrastructure costs
Bottom Line
2026 is a reset year. Liquidity returns, transactions rise, and capital comes back to work—but only for deals that survive real underwriting. Office becomes a selective opportunity set, industrial re-accelerates from a healthier base, and data centers stay hot—while power and infrastructure decide who wins.
If you want to win in 2026, don’t bet on a macro miracle. Build a plan that works anyway.
Ready to act on these trends with real numbers, not headlines? REoptimizer® helps you underwrite smarter, move faster, and avoid the deals that only work in a perfect-rate fantasy.
Whether you’re evaluating an office reposition, screening industrial opportunities, or diligencing a data center site where power is the make-or-break variable, REoptimizer® can help you:
Want a second set of eyes on a 2026 deal? Learn more about REoptimizer® today.
Learn More
CRE transaction management software is a platform that helps you run commercial real estate deals end-to-end—from requirements and site selection through negotiations, approvals, documentation, and close—so every deadline, cost, and decision is tracked in one place (instead of living in spreadsheets, inboxes, and scattered folders).
REoptimizer® is built for exactly this: centralizing portfolio data and automating reporting, alerts, and workflows so teams can move faster and negotiate from a stronger position.

Who Can Benefit from CRE Transaction Management Software?
If your organization has more than a few locations—or multiple deals happening at once—transaction management software becomes a necessity, not a “nice to have.”
Typical users include:
- Corporate Real Estate (CRE) And Portfolio Strategy teams managing growth, consolidation, relocations, and renewals
- Finance / FP&A tracking budgets, approvals, and forecast vs. actual
- Legal managing LOIs, redlines, and compliance documentation
- Operations / Workplace / Facilities aligning space with headcount and utilization
- Executives who need a clear view of deal risk, savings, and timing
REoptimizer® is positioned for enterprise teams dealing with complexity—replacing “spreadsheets, siloed systems, and manual processes” with a single system of record.
What CRE Transaction Management Software Does
At its core, CRE transaction management software helps you:
- standardize the process (repeatable workflows and checklists)
- coordinate people and deadlines (ownership, reminders, accountability)
- organize documents (versions, approvals, audit trail)
- track costs line-by-line (so overages don’t hide in the noise)
- report in real time (so leadership isn’t waiting on a “Friday spreadsheet”)
REoptimizer® adds a key layer: it’s designed to help teams compare deal economics against comps and benchmarks and generate reporting fast with templates—because the real money is won or lost in the details.

Where It Fits (And Why It’s Not The Same As Lease Management)
A simple way to think about the lifecycle:
Before The Deal: Strategy And Site Search
This is where teams define what they need and evaluate options. REoptimizer® supports this with KSDs (Key Site Drivers) and tools like CRESiteIQ™, built to analyze markets, compare sites, and visualize opportunities. More on in the next section…
During The Deal: The Transaction Itself
This is the heavy-lift phase: comps, negotiations, approvals, legal, due diligence, and getting to signature/close.
After The Deal: Lease Management
Lease management is what happens after execution—tracking key dates like renewals, expirations, options, and escalations. REoptimizer® content points out how missed key dates can create real cost and risk at portfolio scale.
Bottom line: lease management is “operate what you signed.” Transaction management is “control what you sign.”
What Are KSDs?
KSDs (Key Site Drivers) are the criteria that define what “best location” means for your business—then you weight and score them so every option can be compared objectively (not emotionally, not anecdotally, and not based on whoever toured last). Consider them your highly unique KPI’s.
REoptimizer® uses KSDs to score each property in real time and calculate a final weighted score per building, instantly ranking your top contenders side-by-side.
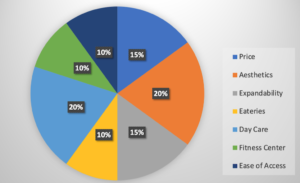
Why KSDs Are Invaluable (And Why Teams That Use Them Win More Often)
They Turn “Opinions” Into A Repeatable Decision System. Without KSDs, site selection usually sounds like:
- “This one feels right.”
- “The price is good, but…”
- “Leadership likes that submarket.”
KSDs force alignment upfront. You define the “must-haves” and “deal-breakers” before you tour, so your team is evaluating every property against the same standard.
They Help You Compare The Stuff That’s Hard To Measure
Price and square footage are easy. The real risk is everything else:
- Workforce access and commute patterns
- Truck access and delivery windows
- Power capacity and future expansion needs
- Column spacing, dock ratios, clear height (industrial)
- Customer proximity and logistics cost impacts
- Rent vs market comps (and trend direction)
- Total Occupancy Cost (rent + CAM/NNN + taxes + insurance + utilities)
- Current utilization vs required utilization (desk sharing, peak days)
- Adjacency needs (teams that must be near each other
- Layout efficiency (loss factor, usable vs rentable SF)
REoptimizer’s® KSD approach is designed specifically to capture those “hard-to-quantify” drivers and make them scorable—so the best site isn’t just the cheapest, it’s the lowest total cost of occupancy and best operational fit.

They Save Time By Eliminating Bad-Fit Tours Early
One of the most expensive mistakes companies make is touring before they’ve defined what matters most. REoptimizer calls this out directly: teams waste time touring warehouses without clear KSDs—then end up revisiting assumptions mid-process. When KSDs are set first, you filter faster and only tour buildings that can realistically win.
They Strengthen Negotiations Because You Know Your Leverage
When you can prove (with scoring) that multiple buildings meet your needs, negotiations change:
- You’re selecting from the strongest options and negotiating from leverage.
- You can back up concession requests with evidence, using comps plus the operational requirements that drive real value.
- You reduce waste by not paying extra for features that don’t move the needle for your business.
Because Reoptimizer® scores contenders side-by-side and ranks them instantly, your team walks into negotiation with clarity: what matters, what doesn’t, and what you can walk away from.
They Keep The Portfolio Aligned With The Business (Not Just The Deal)
The biggest value of KSDs isn’t picking a building—it’s ensuring every location decision supports the business:
- growth plans
- service levels
- labor strategy
- cost targets
- utilization and waste reduction
REoptimizer’s® broader positioning is exactly this: giving teams visibility into overspending and underused space, then translating that into action through dashboards and metrics—so site decisions don’t live in a one-time spreadsheet, they become an operational advantage.
How REoptimizer® Makes KSDs Practical (Not Just A Worksheet)
Here’s the difference between “having KSDs” and using KSDs:
- Score Each Property In Real Time: As you evaluate a site, REoptimizer scores how well it delivers on each KSD—immediately, even while touring.
- Rank Overall Suitability: REoptimizer calculates a weighted score per building and instantly highlights top contenders.
- Expand Site Intelligence With CRESiteIQ™: For location strategy, CRESiteIQ™ helps define what matters and compare sites using many data points (example categories include demographics, income, fuel costs, population trends, and more).

Why Your Portfolio Needs CRE Transaction Management Software
In CRE, savings (or losses) don’t come from “being organized.” They come from making better decisions earlier and catching issues before they get locked into the deal.
Transaction management software helps you:
- Avoid missed deadlines that weaken leverage
- Prevent “death by a thousand line items” (fees, escalations, TI, concessions, operating assumptions)
- Benchmark against comps instead of negotiating blind
- Expose underutilization and waste so the portfolio improves over time
REoptimizer® specifically highlights eliminating wasted effort by centralizing data and automating alerts/workflows—so teams spend time on strategy, not chasing updates.
Why Spreadsheets Don’t Work For Transaction Management
Spreadsheets are fine for a single deal. They fail when you’re handling:
- Multiple stakeholders and approvals
- Changing versions of assumptions and documents
- Market comps, benchmarks, and reporting needs
- Utilization/waste measurement across a portfolio
That’s why REoptimizer® focuses on replacing spreadsheets and siloed tools with a centralized platform and automation.
FAQs
What Is CRE Transaction Management Software?
It’s software that manages the full commercial real estate deal process—tasks, deadlines, documents, approvals, and costs—from strategy through close, so nothing falls through the cracks.
How Is CRE Transaction Management Different From Lease Management?
Lease management is post-signature administration (key dates, escalations, compliance). Transaction management covers the whole process where the economics and terms are created.
Who Needs CRE Transaction Management Software?
Any company with a multi-location portfolio or frequent transactions—especially when deals involve finance, legal, operations, and leadership approvals.
How Does REoptimizer® Help With CRE Transaction Management?
REoptimizer® helps enterprise teams centralize portfolio data and automate reporting, alerts, and workflows—and supports site selection and deal evaluation with KSD scoring and related tools.
What Is CRESiteIQ™?
CRESiteIQ™ is a REoptimizer® tool for site selection, built to analyze markets, compare sites, and visualize opportunities in one platform.
What Are Key Site Drivers (KSDs) In Commercial Real Estate?
KSDs are your business’s weighted location criteria—used to score and compare properties objectively so you can identify the best-fit sites faster.
Why Should KSDs Be Weighted?
Because not all criteria matter equally. Weighting prevents teams from over-prioritizing “nice-to-haves” (or the loudest opinion) over the drivers that actually impact cost, operations, and performance.
How Does REoptimizer Use KSDs?
REoptimizer® scores each property against your KSDs in real time and produces a final weighted score to rank contenders side-by-side.
Learn more about REoptimizer® today.
Learn More
