The technology displacing workers is also, for now, driving one of Manhattan’s strongest leasing recoveries in a decade.
AI firms signed more than 100 leases across Manhattan in 2025 — a 60% jump from the prior year — adding roughly 1 million square feet of office space. Legacy tech firms investing in their own AI capabilities added another 2.1 million. The result: Manhattan’s best leasing year since 2014.

For commercial real estate professionals, the numbers are a welcome reprieve after five years of elevated vacancies and tepid demand from the tech sector. But the boom rests on an uncomfortable paradox. The companies driving this office revival are building tools explicitly designed to reduce reliance on human labor — and the market knows it.
For corporate real estate portfolios, this is a structural market shift with direct implications for supply, pricing power, and long-term space strategy.
The Numbers: A Market in Transition
The scale of AI-driven leasing activity is hard to overstate. Consider the activity across Manhattan alone in 2025:
| Metric | Figure | Context |
| AI firm leases signed | 100+ | +60% YoY |
| AI square footage added | ~1M sq ft | +152% from 2024 |
| AI sq ft currently sought | 1.4M sq ft | Active in market |
| Legacy tech sq ft added | 2.1M sq ft | AI-driven expansion |
| Average AI rent PSF | $88 | vs. $78 citywide avg |
| Peak AI deal | $210 PSF | Select trophy assets |
| Tech share of top 20 leases | ~33% | Up from ~10% prior year |
Headline deals include Harvey AI absorbing more than 185,000 square feet at One Madison Avenue — fully occupying a building that had struggled since its 2023 redevelopment — and OpenAI leasing roughly 90,000 square feet in SoHo for its first New York office.

Anthropic is actively seeking to expand its Manhattan footprint. Elise AI is moving into the former Tiffany building with a 50%-plus expansion. Even Palantir, whose co-founder made headlines for his sharp criticism of Mayor Zohran Mamdani, is reportedly seeking additional space in the city.
“Every industry and company is thinking about how to implement AI technology, and New York is ground zero for that conversation. And every company is here. — Julie Samuels, CEO, Tech:NYC”
Why New York — and Why Now
New York is the second-largest tech hub behind the Bay Area, but several structural shifts have accelerated its AI moment:
- NYC accounts for more than 9% of the country’s AI workforce, leading Seattle, Boston, and Los Angeles.
- Overall tech employment across the five boroughs grew 12% from 2020 to 2024, with an additional 13% projected by 2029 (JLL Research).
- The number of tech firms in Manhattan rose 21% from 2020 to 2024.
- New York boasts more than 8,750 startups — more than San Francisco — and posted more than 25,000 AI-related job openings in 2025, a national high (Tech:NYC / Center for an Urban Future).
- San Francisco remains crowded and expensive; New York offers access to capital, financial sector clients, and a deeper talent pool across verticals.
The cascading effect on submarkets is already visible. As premier Midtown addresses tighten, AI tenants are pushing into previously overlooked districts.
Scale AI relocated from Chelsea to the Financial District after its headcount doubled to 500. Topline Pro, an AI-powered platform for home services companies, chose a converted industrial building in Williamsburg, Brooklyn — deliberately positioning near where employees live and requiring five days per week in-office. Ramp, the financial tech firm, is adding two floors near Madison Square Park.
The Counterforce: AI as an Office Demand Destroyer
For Fortune 1000 occupiers, the current narrative deserves scrutiny. The same firms leasing space today are explicitly building tools designed to reduce human labor. That tension is already visible in equity markets.
Shares of SL Green Realty Corp. and Vornado Realty Trust, two of Manhattan’s largest office landlords, have declined in 2026 in part due to investor concern about AI’s long-term impact on office demand. The market is pricing in a scenario where today’s leasing cycle is real but finite — and where the efficiency gains driving AI growth ultimately compress the headcount that justifies corporate footprints.
For large occupiers managing multi-million-square-foot portfolios across multiple markets, the risk calculus is significant:
- Workforce compression from AI automation may reduce long-term headcount — and with it, the space required to house it
- Lease commitments signed today at premium rents may not align with headcount 5-7 years forward
- As AI tenants drive up asking rents in secondary submarkets, large occupiers face rising renewal and relocation costs
- Landlords are leveraging tight conditions to push longer terms and higher TI structures, increasing portfolio inflexibility
- Sectors most exposed to AI disruption — legal, financial services, professional services — are also the heaviest Manhattan office users
The irony is pointed: corporations deploying AI to reduce costs may simultaneously be absorbing higher occupancy costs driven by AI companies hiring aggressively. Both forces are operating in parallel, and the net effect on portfolio strategy remains unresolved.

Pricing Pressure: What the Data Says About Rents
The tightening is translating directly into rent escalation — particularly in the trophy and near-trophy segment. As of 2025:
- Citywide average asking rent: $78 per square foot
- AI firm average rent paid: $88 per square foot — a 13% premium over market
- High-water mark in AI deals: $210 per square foot
- Most sought-after addresses: $300+ per square foot
- Venture-backed real estate in AI corridors (Little Italy, SoHo, Flatiron): reported 40% rent increases since 2022 in some buildings
For tenants approaching lease expirations in high-demand submarkets, these figures are not abstract. Landlords with leverage will push — and most tenants are negotiating without complete visibility into what comparable deals are actually closing at, not just what is being marketed.
What This Means for Corporate Occupiers
The current market creates a specific challenge for large corporate tenants: conditions are tightening faster than most portfolio strategies anticipated, and the data asymmetry between landlords and tenants has never been greater.
Landlords and their brokers have access to full transaction data across every comparable deal in a submarket. Most tenants — even those with sophisticated in-house CRE teams — are working from marketed asking rents, anecdotal comps, and broker-curated comparables. That gap has a dollar value, and in the current environment, it is substantial.
The most important questions for Fortune 1000 occupiers in this market are not strategic. They are transactional:
- What did the comparable tenant in the same building pay — not what was listed, but what was executed?
- What free rent, TI allowances, and concession structures are landlords actually granting in this submarket right now?
- Is the proposed rent above or below where deals are actually clearing in this asset class and location?
- What does the forward supply pipeline look like in 18–36 months — and does it shift leverage?
The difference between knowing what tenants should pay and knowing what they are paying is the difference between a market-rate deal and an above-market one. In the current environment, the gap can represent millions of dollars over a lease term.
STOP NEGOTIATING BLIND
Know What You Should Be Paying — Before You Sign
REoptimizer® is the first CRE transaction management platform built specifically to close the data gap between tenants and landlords. Powered by AI and trained on over 8,000 data points per transaction, REoptimizer® doesn’t tell you what you should pay — it tells you what you are paying relative to what deals are actually closing at, right now, in your market.
In a market where AI companies are setting new rent ceilings and landlords have more leverage than they have in a decade, data parity isn’t a nice-to-have. It’s a negotiating requirement.
Every warehouse has sprinklers. Very few warehouse operators can confidently answer three basic questions:
-
What hazard was this system designed for?
-
Does that still match what we actually store and how we store it today?
-
If we had a fire tonight, would the system be expected to control it—or are we counting on luck?
If you store more plastics, go higher in the racks, or push into colder parts of the building without revisiting the design basis, you can end up with a system that looks compliant but is unlikely to control a real fire. That gap shows up later as larger losses, tougher insurance conversations, and expensive retrofit projects.
This article breaks down how warehouse sprinkler systems are really designed, where tenants unintentionally outgrow their protection, and what data you should capture for every building in your network

Sprinkler Systems Are Engineered For Use
Sprinkler systems are not “good” or “bad” in the abstract. They are designed around specific assumptions:
-
What you store (commodity and packaging)
-
How you store it (height, racking, flue spaces, aisles)
-
The type of system and water supply (wet, dry, ESFR, in‑rack, etc.)
Change those assumptions enough, and you can end up with a system that looks fine on paper but is under‑designed for a real fire in your current operation.
For tenants, that means:
-
A roof full of sprinklers does not equal “covered.”
-
You need to know what the design basis was and how far you have moved away from it.
Commodity And Storage Height: The Real Starting Point For Sprinkler Design
Sprinkler design in warehouses starts with commodity classification and storage height, not with the brand of sprinkler head.

At a simplified level:
-
Lower‑hazard commodities: Paper, wood, textiles with limited plastic packaging, stored at moderate heights.
-
Higher‑hazard commodities: Consumer goods with significant plastic content, foam, and complex packaging, especially when stored in tall racks.
Every time you change:
-
The product mix (more plastic, more packaged goods, more flammables)
-
The way you store it (higher racks, denser storage, different packaging)
…you are potentially stepping outside the assumptions your system was designed to handle.
Practical takeaway:
You should be able to answer, for each building:
-
What commodity class was used in the original sprinkler design?
-
What is our current commodity and packaging mix?
-
What is our maximum storage height today vs. what the system was designed for?
If those answers do not align, you have a risk flag—whether or not anyone has written you up yet.

Warehouse Sprinkler System Types And What They Are Actually Good For
Most tenants know the wet vs dry distinction. But from a risk standpoint, the more important question is: Is the system type appropriate for my hazard, height, and climate? Here is a concise way to frame it.
Wet Pipe Sprinkler Systems: The Standard Workhorse
-
Pipes are filled with water; when a head opens, water flows immediately.
-
Great for heated spaces and many “ordinary hazard” or moderate‑height storage uses.
Things to watch:
-
Not acceptable in areas that can freeze.
-
May need higher densities or different configurations for tall, plastic‑rich storage.
Dry Pipe Sprinkler Systems: When Freezing Is An Issue
-
Pipes are filled with air; water arrives after a short delay when a head opens.
-
Common in loading docks, unheated sections, and some cold‑storage zones.
Things to watch:
-
More complexity and maintenance.
-
The built‑in delay matters more as the hazard and storage height go up—often leading to a need for in‑rack sprinklers or specialty designs.
ESFR Sprinklers: Built For High‑Piled Storage
-
Early Suppression, Fast Response (ESFR) sprinklers are designed to suppress fires in high‑piled storage, not just control them.
-
Often used for higher storage heights and more challenging commodities, with specific rules on flue spaces and obstructions.
Things to watch:
-
ESFR is sensitive to obstructions (ducts, lights, structural members) and storage layout.
-
“Minor” changes in racking or adding equipment in the ceiling can quietly undermine performance.
In‑Rack, Foam, And Special Hazard Sprinkler Systems
-
In‑rack sprinklers come into play when ceiling‑only protection is not enough for very tall or very challenging storage.
-
Foam or special systems may be needed when you store significant flammable or combustible liquids, or have unusual hazards.
Things to watch:
-
These systems are often tied to very specific design assumptions and maintenance requirements.
-
If you repurpose a building without checking those assumptions, you may inherit a system that is wrong for your new use.
Three Ways Tenants Typically Outgrow Their Warehouse Sprinklers
Across portfolios, the same patterns show up again and again. Most tenants do not deliberately cut corners; they simply expand and evolve faster than the fire protection design.
Pattern 1: Storage Height Creep In Warehouses
-
Racks go higher to gain capacity.
-
Mezzanines or extra levels are added over time.
If those changes push you beyond the design tables used for the original system, you may need higher densities, ESFR, or in‑rack protection. Without that, the system may never have had a realistic chance of controlling a worst‑case fire.
Pattern 2: More Plastics And Different Packaging
-
Product lines shift toward more plastic‑heavy consumer goods, foam, or complex packaging.
-
Pallet patterns and packaging practices change, often increasing exposed plastic surface.
The fire load increases, sometimes dramatically, but the system still assumes a lower commodity class.
Pattern 3: Cold Storage And Marginal Temperatures
-
Portions of a building run near freezing, or are converted to refrigerated use after the fact.
-
Wet systems are exposed to freezing risk, or dry systems are extended into areas they were not originally designed for.
The result can be pipes that freeze and fail, or delayed water delivery in precisely the areas you can least afford it.
Essential Sprinkler Data Every Warehouse Tenant Should Capture
You do not need to run hydraulic calculations. But if you operate multiple warehouses, there are a few pieces of information you should standardize across all sites.
For each location, capture:
-
System Type: Wet, dry, ESFR, in‑rack, pre‑action, foam, etc.
-
Design Basis Snapshot:
-
Commodity class used in design
-
Maximum storage height assumed
-
Any special notes (for example, “ceiling‑only ESFR for Class I–IV up to X ft”)
-
-
Current Operation:
-
Actual commodity mix and highest‑hazard items
-
Actual max storage height and racking layout
-
-
Inspection & Maintenance Status:
-
Dates and outcomes of recent inspections and tests
-
Known deficiencies or open findings
-
Once you have this information, even in a simple consistent template, you can:
-
Spot where your use has outrun your design basis.
-
Prioritize which facilities need engineering review or upgrades.
-
Make better decisions about renewals, expansions, and consolidations.

How To Use Sprinkler Data In Real Warehouse Lease Decisions
Here are a few practical ways sophisticated tenants use sprinkler data to make better calls.
Before Signing A Warehouse Lease
-
Ask for the fire protection drawings and a brief design narrative.
-
Confirm the system was designed for something close to your planned commodities and storage heights.
-
If not, quantify what upgrades or changes would be needed—and either negotiate or walk.
Before Changing What You Store Or How You Store It
-
Treat significant changes in commodity mix or storage height as triggers for a fire protection review, not just an operations decision.
-
Ask, “What did we tell the engineer or landlord when this system was designed, and how is today different?”
At Renewal, Expansion, Or Consolidation
-
Put sprinkler system adequacy on the same checklist as rent, TI, and location.
-
If a building’s system is marginal for your current or future use, factor upgrade cost, downtime, and insurance impact into the comparison.
Where Warehouse Portfolio Software Quietly Helps
Once you spread this thinking across a portfolio, the challenge is not understanding the concepts—it is keeping track of the details for 10, 50, or 500 buildings.
Portfolio and transaction management software can help by:
-
Giving you a standard way to record the sprinkler design basis and current use for each site.
-
Letting you quickly filter for mismatches (for example, high‑piled plastics in buildings without appropriate protection).
-
Putting that information in front of you when you are making lease and network decisions, instead of buried in old drawings.
When you are ready to move beyond one‑off sprinkler checks and spreadsheets, REoptimizer® gives you the portfolio view you are missing. It centralizes lease, building, and fire‑protection data by site so you can see, in seconds, where your storage has outgrown the original design—and act before it becomes a costly problem.
If you want to know which warehouses in your network have the biggest mismatch between what you store and how you are protected, request a REoptimizer® demo and map your sprinkler risk across your entire portfolio in one place.
Most CEOs treat a commercial lease renewal like a routine administrative task—something for the legal department to “handle” or for a junior facilities manager to “check off.”
That is the single most expensive mistake you will make this decade. In today’s market, a lease renewal isn’t a paperwork exercise. It is a Strategic Arbitrage Opportunity. If you do it right, you unlock millions in pure profit. If you do it passively, you are signing a high-interest loan on space you don’t use, based on prices that no longer exist.
So, without wasting any more time, let’s explore how to treat your lease like a financial asset instead of a liability.

The Reality: You Are Negotiating in a Time Machine
The office market didn’t just “shift”—it collapsed and rebuilt itself while you were busy running your business.
Most companies are currently sitting in leases negotiated 3, 5, or 7 years ago. Those leases were built on a “Before Times” world:
-
Utilization was linear. (Everyone showed up at 9:00 AM).
-
Landlord leverage was absolute. (Vacancy was low; options were few).
-
Growth meant more desks. (If you made more money, you needed more carpet).
In 2026, all three of those assumptions are dead. The gap between your “Contracted Rent” (what you’re paying now) and “Market Reality” (what the building is actually worth) is likely wider than the Grand Canyon. If you simply “exercise your option” without a diagnostic, you are essentially tipping your landlord millions of dollars for the privilege of staying in an outdated office.
The Four Villains of the Lease Renewal
1. The Familiarity Bias (The “Paperwork” Trap)
Tenants assume staying put is “safe.”
You know the commute, you like the coffee shop downstairs, and your employees know where the bathrooms are.
In reality, familiarity is a tax. Landlords count on you resigning without proper due dilligence.
They know that moving costs money and time, so they offer you a “fair” renewal that is actually 15% above the net-effective market rate. They are charging you a “Convenience Surcharge.”
2. Blind Portfolio Economics
Most companies negotiate renewals in a vacuum.
They look at the current rent and try to knock a dollar off. But they don’t look at the Remaining NPV (Net Present Value) of the lease. They don’t see how the 3% escalations are compounding into a massive balloon payment in year eight. If you don’t know the “Total Cost of Ownership” of that location compared to your top five competitors, you aren’t negotiating—you’re begging.
3. The “Ghost Square Footage”
This is the biggest profit killer. You are paying for 50,000 square feet because that’s what you needed in 2019. But your badge-swipe data shows that on Tuesdays—your peak day—you only use 28,000. Every square foot you don’t use is Dead Capital. If you renew for the same footprint, you are essentially setting piles of cash on fire every month to heat and cool empty air.
4. The “No Alternative” Bluff
Landlords are expert poker players. If they don’t see you touring other buildings, they know they have you trapped. Leverage doesn’t come from being a “good tenant.” Leverage comes from Credible Alternatives. If you don’t have three other buildings “hot on the trail” with net-effective term sheets, the landlord has no reason to give you the concessions you actually deserve.

The “Value Stack” of a Modern Renewal
When we talk about “optimizing” a renewal, we aren’t just talking about lower rent. We are talking about the Total Value Stack. In a buyer’s market, you should be negotiating for:
-
TI Dollars (Tenant Improvement): The landlord should be paying to refresh your space, not you.
-
Abatement (Free Rent): You should get months of free rent just for signing the extension.
-
Contraction Rights: The ability to give back 20% of the space if your hybrid policy shifts.
-
OpEx Caps: Protecting yourself from the landlord’s rising insurance and tax bills.
How to Build a Finance-Grade Decision (The REoptimizer® Way)
If you want the CEO and CFO to sign off on a real estate decision, you can’t bring them “feelings” or “anecdotes.”
You need a Visual Truth Engine. This is where REoptimizer® comes in.
We didn’t build a database; we built a Leverage Machine.
1. Stop Guessing, Start Measuring
REoptimizer® centralizes your portfolio data so you can see the Remaining NPV of every lease in one click. You can instantly see which locations are “financial outliers”—the ones where you are paying 2021 prices in a 2026 world.
2. The Utilization Diagnostic
Instead of asking, “How much space do we cut?”, we ask, “How should our space actually work?” Our platform helps you map true utilization against your footprint. If you’re at 40% capacity, we model the exact “Right-Sizing” scenario that preserves your culture while slashing your OpEx.
3. Side-by-Side Scenario Modeling
This is the “Grand Slam” move. We take your current renewal terms and put them side-by-side with the top 3 relocation options in the market.
-
Option A: Renew (The “Standard” Path)
-
Option B: Restructure (The “Blend and Extend” Path)
-
Option C: Relocate (The “Maximum Leverage” Path)
We calculate the Net Effective Cost of all three, including moving costs, IT build-out, and downtime. When you show the landlord that Option C is $2 million cheaper over 10 years, the “negotiation” suddenly gets a lot shorter.
The Timeline of Leverage
If you start your renewal 6 months before your lease ends, you have already lost. You are a hostage to the clock.
To win, you must start 18 to 36 months out. * 36 Months: Start the diagnostic. What is the NPV? What is the utilization?
-
24 Months: Identify the “Credible Alternatives.”
-
18 Months: Begin the “Battle of the Term Sheets.”
Time is the only thing you can’t buy back. If you have time, you have the power to walk away. If you don’t have time, the landlord owns you.

The Bottom Line: Renewals are Where Portfolios are Won or Lost
You can’t manage what you don’t measure. In 2026, “winging it” with a spreadsheet is a recipe for a $5 million mistake.You need a platform that turns your fragmented lease data into Market Power. You need to see the “Matrix” of your portfolio before you sit down at the table.
The Question: Are you going to pay the “Paperwork Tax” for another five years, or are you going to optimize your footprint for the way you actually work?
Ready to Find the “Ghost Space” in Your Portfolio?
Don’t sign another lease until you’ve seen the data. Whether you have 5 locations or 500, REoptimizer® gives you the finance-grade intelligence to make renewals your biggest win of the year.
Stop overpaying for “Dead Air.” Request a demo today to explore the leverage and cost-saving abilities REoptimizer® can have on your portfolio.
Commercial Lease Renewal FAQs (The Cheat Sheet)
Q: When should I start planning? A: 18–36 months before expiration. If you’re under 12 months, you’re already losing leverage.
Q: Should I exercise my “Renewal Option”? A: Almost never as the first move. Options usually reset to “Fair Market Value,” which is subjective. Negotiate a fresh deal first; use the option as a safety net only.
Q: How do I know if I’m overpaying? A: If your rent has 3% compounded escalations and you signed before 2023, you are almost certainly overpaying.
Q: What is “Remaining Lease NPV”? A: It’s the value of your future debt in today’s dollars. It’s the only way to compare a “Stay” vs. “Go” decision with total financial clarity.
Q: Can REoptimizer® help with just one location? A: Yes, but it’s a superpower for companies with 10+ locations that need to see where the “bleeding” is happening across the entire map.
By early 2026, the real estate market has reached a critical inflection point. For institutional building owners and global corporate tenants, the conversation around office to residential conversion has matured from a speculative “doom loop” narrative into a surgical, data-driven trade. We are no longer discussing the death of the office market; we are analyzing the strategic birth of high-yield residential use from the chassis of obsolete office space.
The following points illustrate the nuance of this new conversion story:
- Beyond “Cutting Losses”: The narrative has moved past being a desperate solution to mitigate the drag of unoccupied space. It is now a proactive strategy to unlock value. As high-quality Class A+ assets find their footing, the commodity-grade older office buildings that once anchored the central business district have become “stranded assets”—properties whose utility has been outpaced by shifting market needs and strict ESG requirements.
- The “Basis Reset” as a Structural Catalyst: The current trend is not a reaction to a temporary vacancy spike; it is a permanent structural response to a fundamental valuation shift. This “Basis Reset” occurs as office investment values decline, allowing developers to acquire vacant office space at a low entry price (the “basis”). This reset is essential to offset conversion costs.
- A Shift in Management Philosophy: For the sophisticated owner, the story has shifted from merely managing occupancy to maximizing the terminal value of their portfolio. In 2026, the math is clear: if an office building can no longer compete for high-yield office space demand, its highest and best use is inevitably residential housing.
- Financial Feasibility and Yield Spreads: Institutional capital now focuses on the delta between a property’s Net Operating Income (NOI) as a struggling office versus its stabilized value as a multifamily asset. By leveraging tax incentives like NYC’s 467-m program and historic tax credits, developers are bridging the “capital stack” gap to achieve a positive Net Present Value (NPV).
The Strategic Re-Underwriting of Vacant Office Space
By early 2026, office vacancy rates have stabilized near 14% nationally, but this average masks the deep distress in central business districts. Office vacancy rates in major hubs like New York and San Francisco have hit a structural ceiling, often hovering between 20% and 30%.
However, this is not a universal failure; it is a bifurcation. While Class A+ trophy assets maintain a “flight to quality,” older office buildings and Class B/C commercial space are facing terminal economic obsolescence. The financial feasibility of converting these empty office buildings into residential units is driven by the widening delta between office NOI and surging apartment rents.
- The Basis Play: Sophisticated developers are targeting old offices where the acquisition cost is low enough to absorb conversion costs that frequently exceed $250 per square foot.
- Speed to Market: Adaptive reuse allows for residential construction that is 20% cheaper and 8–16 months faster than new construction, a critical advantage in a housing crisis where housing units are needed immediately.

Architectural Nuance: Navigating the Physical “Stranded Asset”
A large scale conversion is a surgical operation on a building’s DNA. Now, owners must move beyond the basic “floor plate” conversation to address the complex engineering required to turn a cube-farm into a luxury apartment.
Deep Core Modification & Natural Light
Most modern office buildings feature massive, deep floor plates (exceeding 100 feet in depth) that are fundamentally incompatible with living space requirements for natural light.
- Structural Voids: To meet building codes, developers are increasingly “carving out” the center of existing buildings to create light wells or atria. This reduces rentable square footage but maximizes the desirability—and the rent—of the units.
- HVAC and Air Conditioning: Transitioning from massive central chillers to individual, unitized air conditioning is one of the highest conversion costs. In 2026, the standard has shifted to high-efficiency VRF (Variable Refrigerant Flow) systems.
Sustainability and the ESG Premium
Reusing a commercial building shell is the “greenest” possible construction method.
- Embodied Carbon: Adaptive reuse saves 50–75% of the embodied carbon compared to a teardown.
- Federal Resources: The White House and federal agencies have unlocked federal resources and historic tax credits specifically for developers who can prove high-carbon savings through building conversions.
The Legislative Catalyst: 2026 Incentives and Tax Breaks
Local governments have finally pivoted from red tape to red carpet. To protect the tax base and the city’s transfer tax revenues, city leaders are aggressively subsidizing the office to residential pipeline.

The 467-m Property Tax Exemption (NYC)
The most significant policy of 2026 is NYC’s 467-m program, designed to turn obsolete buildings into affordable housing.
- The Mandate: 25% of the apartments must be affordable units (rent-restricted at 80% AMI).
- The Benefit: Developers receive a massive property tax abatement for up to 35 years, stabilizing the financial analysis of the most complex conversion projects.
National Comparisons of Conversion Policy
| City | Primary Incentive | Objective |
| Pittsburgh | “By-Right” Zoning | Bypasses zoning hearings for office conversions. |
| Los Angeles | Adaptive Reuse Ordinance | Targets multifamily housing in the urban core. |
| Chicago | LaSalle Reimagined | Grants for rent restricted units in high-vacancy zones. |
| Philadelphia | Historic Tax Credits | Preserves older office buildings while adding housing supply. |
Strategic Portfolio Defense: Beyond the Conversion Hype
While the headlines focus on large scale conversions, the reality for most global occupiers is a complex chess match of lease management and location strategy. As building owners seek financial feasibility for residential properties, tenants must understand how these shifts impact their specific office space demand.
The REoptimizer® Advantage: 8,000+ Data Points for Precision
REoptimizer® is the industry-standard transaction management software designed to help you play offense in a volatile market. It doesn’t just track dates; it synthesizes over 8,000 data points—from local vacancy rates to shifting building codes—to ensure your portfolio is a driver of value, not a drain on capital.
For the sophisticated corporate leader, REoptimizer® acts as a tactical defense layer:
- Local Market Benchmarking: Access real-time local vacancy rates and comparable lease data to identify exactly where you are paying over market.
- Negotiation Leverage: Armed with granular data, you can approach building owners from a position of strength, identifying opportunities for rent reductions or tenant improvement allowances based on the asset’s true market health.
- Lease Protection: Automatically flag vague or one-sided terms in your leases that could trigger unexpected costs or limit your ability to pivot as the office market bifurcates.
- Dynamic Portfolio Rightsizing: Use workplace analytics to bridge the gap between your current square feet and your actual utilization, allowing you to “shrink to grow” into higher-quality, better-located assets.
In a market where the line between commercial viability and structural obsolescence is thinner than ever, data is the only hedge against uncertainty. By transforming 8,000+ complex variables into clear, actionable intelligence, REoptimizer® ensures you aren’t just reacting to market shifts—you are anticipating them.
Stop overpaying for underutilized space and start optimizing your terminal value.
Book a Demo with REoptimizer® Today
Book a Demo
FAQ: The 2026 Conversion Landscape
What defines a viable office to residential conversion project?
Viability is dictated by floor plate depth, access to natural light, and the acquisition basis. Only about 30% of office buildings are suitable. Ideal candidates are usually older office buildings with shallower depths and high office vacancy.
How do conversion costs impact the financial feasibility of housing?
Conversion costs range from $100 to $500 per square foot. Because of these high costs, most large scale conversions require tax incentives or property tax abatements to produce affordable housing or rent restricted units while remaining solvent.
What are the main benefits of adaptive reuse over new construction?
Adaptive reuse is faster (saving up to 16 months) and more sustainable, as it rehabilitates an existing building. It also avoids the high cost of new foundations and site prep, making it a powerful tool to address the housing shortage.
How do local governments facilitate building conversions?
Local governments use “by-right” zoning, tax breaks, and historic tax credits to reduce the regulatory hurdles for building owners. These policies are designed to revitalize the central business district and increase the housing supply.
As we move through 2026, the mandate for corporate occupiers has shifted. Whether managing high-density office space or sprawling warehouse networks, the goal is to align footprint with economic growth while mitigating the rising costs of occupancy in a booming market.
And now, the current real estate landscape is no longer about recovery; it’s about capitalizing on growth. 2025 marked the third consecutive year of growth, with $472.6 billion in transactions—a 19.9% surge in total dollar volume. A lot of these investments were concentrated in certain cities where market conditions have paved the way for more sustained real estate growth.
So, without further ado, here are the top markets to keep pay attention to and the key factors that make them such strong players.
Best City Real Estate Investment: Dallas-Fort Worth
Dallas-Fort Worth has solidified its position as the primary anchor for national portfolios. With $22.3 billion in activity, it is currently the benchmark for the best city real estate investment based on liquidity and corporate migration.
- Macro Indicators: Deals climbed 3.9% while dollar volume rose 6.6%, indicating a tightening, highly competitive environment.
- Occupier Advantage: Outside of industrial, nearly every property type is seeing positive results, making it an ideal hub for diversified regional HQs.
- Strategic Outlook: Tightening bid-ask spreads suggest that the window for aggressive lease negotiations is closing as investor conviction builds for an “accelerated 2026.”

The San Francisco Bay Area
Surprised?
After a tumultuous few years, the Bay Area proved its structural importance in 2025, closing the year with $20.5 billion in real estate investment.
This 24.6% increase in dollar volume signals that institutional capital is doubling down on the world’s premier innovation hub.
- Momentum: A robust surge in activity between Q3 and Q4 suggests a “flight to quality” that corporate tenants must navigate.
- Talent Density: With a 16.2% increase in transactions, the competition for trophy office space is intensifying, requiring occupiers to move with higher velocity.
Los Angeles
Los Angeles is playing a long game. While the fourth quarter showed a slight cooling, the annual growth of 21.8% in dollar volume highlights the city’s enduring status as a critical node for logistics and entertainment.
- Industrial Resilience: L.A. remains a top-tier choice for those looking to buy rental property or industrial hubs due to its proximity to global trade routes.
- Growth Profile: An 11.1% increase in transaction count suggests a healthy, active market.
- Occupier Takeaway: The “measured” nature of the recovery allows for more strategic, data-driven site selection compared to more volatile hubs.

New York City
New York’s $18.8 billion in activity reflects a stabilizing giant. While dollar volume increased by only 1.1%, the city’s undisputed lead in job growth ensures that high-scale tenants remain anchored to the Manhattan core.
- Transaction Stability: A 5.1% rise in deal count shows a healthy market “churn,” allowing for strategic consolidation and “blend-and-extend” lease opportunities.
- Executive Takeaway: NYC remains the gold standard for portfolio stability, even as high-growth “sunbelt” cities capture the headlines.
Real Estate Momentum in Miami
Miami is the outlier in terms of pure velocity. Total volume surged 34.7% in 2025, underscoring massive confidence across all property types.
- The Inbound Wave: Transactions jumped 15.5% as the “Wall Street South” trend translates into long-term real estate commitments.
- The Cost of Confidence: This is a seller’s market. Occupiers need sophisticated data to avoid over-leveraging in a region where prices are detaching from historical norms.
Housing Demand: The Phoenix and Las Vegas Shift
Both Phoenix and Las Vegas represent the intersection of housing demand and commercial expansion. While Phoenix saw a 2.8% rise in transactions, Las Vegas continues to evolve into a diversified corporate player, moving well beyond its hospitality roots.
- Phoenix Turnaround: Analysts describe the 18% decline in dollar volume as “subtle growth,” indicating a market reset that could offer a high potential return for those entering in early 2026.
- Secondary Market Strength: These different locations are no longer “alternatives”—they are core requirements for logistics-heavy portfolios.
Booming Market Trends: Denver and Austin
Investors remain “increasingly optimistic” about Denver, where deals rose 20.8% and volume climbed 30.1%. Austin, meanwhile, saw a 40.7% leap in total volume despite a slight dip in transaction count.
- Concentrated Capital: Austin’s volume leap suggests that when corporations buy real estate in the region, they are investing in large-scale, tech-centric campuses.
- Long-term Fundamentals: Both cities lead the nation in economic growth per capita, making them essential for any high-growth portfolio.
Best Cities for Strategic Value: D.C., Atlanta, and Chicago
Performance in major metropolitan areas is not monolithic, offering “value play” opportunities:
- Washington, D.C.: A “bid-ask disconnect” has led to an 11.6% drop in volume despite more deals closing. For tenants, this is a prime opportunity for landlord-funded capital improvements.
- Chicago: An 18.2% increase in transactions shows investors capitalizing on lower office asset prices.
- Atlanta: Despite a 15.2% volume dip, the market is primed for “positive investment momentum” as it recalibrates for 2026.

Why “Housing Demand” is a Commercial Problem
For large-scale tenants, housing demand is a critical supply-chain issue. If the workforce cannot find affordable housing near your warehouse or office, your operational resilience is at risk.
The best cities for corporate expansion are those that successfully balance commercial job growth with residential supply. This is why savvy C-Suite leaders are now monitoring multifamily investment trends as a leading indicator of talent mobility and labor costs.
Strategic Challenges for Large-Scale Portfolios
Managing a national footprint of office and warehouse space across different locations involves three critical hurdles:
- The Bid-Ask Disconnect: Navigating the gap between landlord expectations and market reality requires hard data.
- Market Granularity: Knowing when to buy real estate in a high-conviction market like Austin versus waiting for a turnaround in Charlotte (where volume fell 21.8%).
- Portfolio Optimization: Ensuring that every square foot is actively contributing to the company’s potential return.
The REoptimizer® Edge: Turning Data into Leverage
In a market where total volume is approaching $500 billion and transactions are rising by nearly 20% year-over-year, spreadsheets are no longer sufficient. REoptimizer® is the critical transaction management and portfolio optimization software designed specifically for the corporate occupier.
- Centralized Intelligence: Benchmark your leases against the 30,425 transactions currently shaping the major metropolitan areas.
- Strategic Execution: Whether you need to lease or buy real estate for a new regional hub or optimize a legacy warehouse, our platform provides the transparency needed to close the “bid-ask disconnect.”
- Yield Optimization: Align your footprint with job growth and economic growth metrics to ensure your real estate is a strategic asset, not a sunk cost.
- Hyper-Localized Site Selection: Layer over 200 granular data points—from commuter patterns and traffic density to local infrastructure—on a single map to pinpoint properties that align with operational requirements and talent accessibility.
The 2026 market is an “operator-led” environment, and for corporate occupiers, the margin for error has never been thinner. The best cities for expansion are no longer determined by intuition, but by the intersection of demographic data and capital flows.
Those who utilize professional software to navigate these major metropolitan areas will be the ones who capture the most value while others are still catching up to the data.
Is your portfolio ready for the 2026 surge? Schedule a demo with REoptimizer® today to see how we help the world’s leading occupiers dominate the market through data.
Book a Demo
In the current labor market, a quiet but profound shift is taking place. While “restructuring” and “streamlining” are the headlines, the complete reality is a structural technological disruption driven by artificial intelligence. This isn’t just about productivity gains; it’s a fundamental change in how companies calculate their need for human capital and, by extension, office space.
Recent data from 2025 and early 2026 shows that artificial intelligence loss of jobs is no longer a theoretical risk—it is a measurable trend. Tech giants and financial institutions are trading human headcount for AI infrastructure, leading to a new economic formula: fewer employees, more AI models, and significantly smaller office footprints.

Recent College Graduates and the “First Kill Zone”
The AI revolution is not affecting all workers equally. Recent labor statistics show a “white-collar bloodbath” concentrated among recent college graduates and early-career workers. Research indicates that junior positions are shrinking at businesses integrating AI automation. This technological change hits the “First Kill Zone” hardest: roles defined by repetitive tasks and structured workflows that once served as the “bottom rungs” of the career ladder.
“We are seeing the ‘hollowing out’ of the entry-level tier. Companies are no longer hiring five juniors to find one star; they are hiring one star equipped with an AI agent.” — Sector Analysis, 2025 Global Workforce Report.
Software Development: Smaller Teams, Fewer Desks
The classic model of massive engineering departments occupying multiple floors is dissolving. Software development is seeing significant job displacement as AI agents move from simple code completion to full-scale architecture.
- Efficiency Gains: Tools like GitHub Copilot and Amazon CodeWhisperer allow a single developer to do the work that previously required a small team.
- Space Impact: Projects that once justified 50-person “bullpens” are now being handled by 10-person specialist pods, leading to immediate office contraction.
- Junior Hiring: Many firms are reducing their intake of entry-level developers, preferring a lean team of senior staff who can audit AI-generated code.
Legal and Compliance: The End of the Associate Army
In the legal sector, the “army of junior associates” once required for document review and research is being replaced by sophisticated AI platforms.
- Research Speed: AI models like Harvey can parse thousands of NDAs and case files in seconds, a task that used to take weeks of human labor.
- Headcount Reduction: When one platform does the work of 20 junior associates, the need for large Manhattan or D.C. office suites disappears.
- Lease Risks: Law firms often hold long-term, expensive leases; AI is making the square footage per partner metric look increasingly bloated.
Bank Tellers and Finance: The Automation of Logic
Bank tellers and routine accounting staff are facing a new wave of job losses as structured data meets automated logic.
- Reconciliation: AI now handles account balancing, anomaly detection, and routine reporting before a human even logs in.
- Branch Closures: The shift toward digital-only interactions has rendered traditional bank branches and regional finance hubs obsolete.
- Departmental Shrinkage: Finance departments that once required 100 people are right-sizing to 30-40 specialists, leaving vast amounts of “shadow vacancy” in their office portfolios.
The World Economic Forum predicts that by 2030, over 200,000 U.S. accounting jobs will vanish due to AI-driven reconciliation.
Customer Support: The Death of the 500-Seat Floorplate
Customer support centers were once a primary driver of suburban office demand. Today, they are the primary example of the job market being reshaped by AI agents. Klarna revealed its AI assistant performed the work of 700 full-time agents, handling two-thirds of customer service chats in its first month.
- Tier 1 Resolution: AI chatbots and voice agents now resolve up to 95% of routine queries, including refunds and scheduling.
- Footprint Collapse: Companies no longer need massive call centers with break rooms and parking lots when the majority of the “workforce” exists on a server.
- Outsourcing Shifts: Even offshore BPO hubs are seeing a decline in demand as companies bring support back in-house via localized AI models.

Job Displacement and the Commercial Real Estate Disruption
The potential for widespread displacement has a direct, evolving impact on commercial real estate (CRE). For decades, employers leased space based on headcount. Today, AI adoption means a firm can double its output while eliminating half of its physical desks.
- Shrinking Floorplates: Companies like Amazon and UPS have confirmed thousands of layoffs as they shift capital toward AI products. The demand is moving from “seats for people” to “racks for servers.”
- The Rise of the “Jewel Box” Office: Organizations are exiting massive, automated back-office cubicle farms in favor of smaller, high-quality “collaboration hubs.”
- Early Signs of Distress: Class B and C assets in cities that once relied on healthcare admin and insurance support are seeing record-high vacancies as those jobs lost to automation do not return.
Amazon recently confirmed an additional 14,000 layoffs as it shifts over $100 billion in capital expenditures toward AI products and logistics tech.
Artificial Intelligence: Navigating the New Job Market
As technological innovation creates new occupations in AI oversight, it simultaneously renders legacy employment models obsolete. To avoid being locked into a firm’s past, occupiers must treat their future real estate as an elastic asset. In the current job market, the square footage requirements of 2026 are fundamentally different from those of 2020.
- Renegotiate on Reality: Use recent data on your AI-driven headcount projections to right-size now.
- Focus on Flexibility: Shift to 3-5 year terms. In an economy where a single department can be automated overnight, a 10-year lease is a significant risk.
- Audit the “Kill Zones”: Identify which departments are seeing the highest risk of displacement and reduce those specific square footages first.
How REoptimizer® Keeps You Ahead
The AI revolution moves faster than typical cyclical downturns. To stay competitive, you need more than just general labor statistics—you need a process to identify excess space before it becomes a liability.
REoptimizer® provides the real-time intelligence needed to model workforce changes and negotiate from a position of strength. Don’t let your portfolio be defined by job losses; define it by the productivity gains of a leaner, smarter organization.
Book a demo today to see how AI and REoptimizer® can revolutionize your portfolio.
Book a Demo
In the current commercial real estate landscape, the traditional lease audit is evolving. High-level corporate tenants are no longer just looking at their own square footage; they are looking at the property’s profitability.
For a tenant in a high-rise office or a sprawling warehouse, the landlord’s net operating income (NOI) is the heartbeat of the building. If that heartbeat flutters, your services—from security to climate control—are the first to suffer. Understanding how to calculate net operating income is no longer just for commercial real estate investors; it is a critical survival skill for portfolio managers.
Net Operating Income: The Tenant’s Risk Barometer
Net operating income is a fundamental valuation metric that measures a property’s income after deducting operating expenses but before financing and taxes. For a tenant, a healthy net operating income noi signifies a landlord who has the liquidity to reinvest in the building. Conversely, a shrinking NOI suggests a landlord who may be forced to cut corners on property management and essential operating costs.
Formula of Net Operating Income
To understand the financial health of your building, you must look at the formula of net operating income. At its simplest, the net operating income formula is:
While real estate investors use this to determine property value, tenants should use it to gauge operational performance. If the operating expenses are being artificially suppressed to prop up the NOI, the “deferred maintenance” bill is quietly growing—and you will eventually pay it through poor service or emergency escalations.

Gross Operating Income: More Than Just Tenant Rents
The first step in the noi calculation is determining the gross operating income. This represents the total revenue the property generates if it were fully functional, minus vacancy losses.
Gross income includes:
-
Tenant rents: The primary rental income.
-
Ancillary income: Revenue from parking fees, laundry services (in flex/mixed-use), and communications infrastructure.
-
Additional income: Vending, signage, and other revenue generated by the asset.
A landlord struggling with revenue growth in tenant rents may become aggressive with ancillary income or “nickel-and-diming” tenants on administrative costs.
Calculate Net Operating Income: Peeling Back the Expenses
To calculate NOI accurately, you must understand what qualifies as an actual cash expense. To arrive at the actual NOI, the property owner subtracts total operating expenses from the gross income.
Common operating expenses include:
-
Property taxes and income taxes (where applicable).
-
Property management fees and maintenance fees.
-
Insurance and utilities.
-
Operating costs for common areas.
Crucially, net operating income does not include financing costs, debt payments, interest payments, or capital expenditures. This is where tenants get tripped up: a building can have a “positive” net operating figure while still being in a cash-flow crunch due to high interest rates on its loan payments.
Net Income vs. Net Operating Income
It is vital to distinguish between net operating results and net income. While net operating income focuses on the property’s ability to generate cash flow from operations, net income is the “bottom line” after all business expenses, including interest expense and debt service payments.
If a landlord’s net income is negative despite a positive NOI, the property is likely over-leveraged. REoptimizer® helps you spot these discrepancies by comparing your building’s financial efficiency against comparable properties in the property’s market.

Cap Rate: How NOI Dictates Property Value
The cap rate (or capitalization rate) is the link between net operating performance and market value.
For the tenant, the cap rate is a signal of risk. A very high cap rate compared to the property type average may indicate a “value-add” property where the landlord is desperately trying to calculate noi increases by slashing property’s operating expenses. This often leads to a decline in operational efficiency and a poor tenant experience.
Calculate NOI to Predict Tenant Improvement (TI) Capacity
One of the most practical reasons to calculate net operating income is to assess a landlord’s ability to fund tenant improvements.
If the NOI calculation example for your building shows a tightening margin, the landlord likely lacks the net profit to offer competitive TI packages. They may even struggle to fund capital expenditures like elevator modernizations or HVAC overhauls, which are not included in noi but are essential for actual profitability.
Managing Multiple Properties with REoptimizer®
In a large-scale portfolio, manually reviewing the income statements for every rental property is impossible. This is where REoptimizer® becomes your most valuable asset. Our software allows you to:
-
Benchmark Operational Performance: Compare the operating profitability of your landlords across multiple properties.
-
Flag NOI Instability: Automatically detect if total operating expenses are out of sync with market trends.
-
Audit Property Management Fees: Ensure you aren’t overpaying for management fees that aren’t translating into operational efficiency.
-
Visualize Cap Rate Compression: Understand how property value shifts affect your landlord’s ability to maintain the investment property.
The REoptimizer® Advantage: Beyond the Spreadsheet
Don’t let your commercial real estate strategy be dictated by a landlord’s hidden financial strain. By understanding the formula of net operating income and utilizing REoptimizer® to monitor noi calculation trends, you shift the power dynamic back in your favor.
Are you ready to audit your portfolio’s true risk?
REoptimizer® provides the tools to see through the gross income and find the actual cash expense realities of your landlords. We help you identify the “red zone” properties where operating income is insufficient to support long-term property’s profitability.
Book a demo today for a data-driven portfolio review. Let us show you how to use NOI insights to secure better lease terms and protect your operational future.
For the Fortune 500 real estate director, a lease is more than a right to occupy; it is a long-term liability that requires active hedging. Central to this hedge is the expense stop, a mechanism that defines the boundary between a predictable overhead and an escalating variable cost.
The expense stop is the pivot point of this risk. It is a contractual provision that sets a maximum limit on the landlord’s operating expenses.
While it serves to provide a predictable “floor” for the landlord’s contribution, it simultaneously functions as a latent liability for the tenant. For the sophisticated occupier, understanding the interplay between the base year, actual expenses, and annual increases is the difference between budget stability and an unexpected multi-million dollar hit to the EBITDA.
Expense Stop: The Landlord’s Hedge and the Tenant’s Exposure
An expense stop in commercial real estate is essentially a risk-transfer mechanism. It is primarily used in Full-Service Gross Leases to protect landlords from rising costs while providing tenants with a predictable initial rent. By setting a certain amount—typically expressed per square foot—the landlord caps their financial liability.
From the landlord’s perspective, this provision ensures predictable cash flow. The risk of rising inflation, sudden spikes in utility costs, or labor increases for building expenses is transferred to the tenant.
If the actual operating expenses rise to $12 per square foot while the expense stop amount is set at $10, the tenant is responsible for the $2 difference. On a 100,000-square-foot headquarters, this “minor” fluctuation results in a $200,000 unbudgeted expense.
However, the expense stop is not inherently predatory; it can provide predictability for tenants in terms of operating expenses, allowing them to budget effectively for the first year. The risk, however, is that if the initial stop is set artificially low during lease negotiations, the tenant may be exposed to large, immediate increases in subsequent years.
Base Year: Defining the Economic Baseline
The base year is the chronological anchor of a commercial lease. While it can be any year agreed upon, it is typically the first year of the lease term. In a full service or modified gross lease, the landlord pays for all operating expenses incurred during this period. The actual amount of expenses tied to this window becomes the “floor” for the remainder of the term.
For the C-suite, the base year amount is a critical data point. If a tenant signs a lease in a building that is only 50% occupied during the base year, the actual expenses will be deceptively low. As the building fills and occupancy reaches 95%, the variable expenses—such as janitorial services, utilities, and property management fees—will skyrocket.
Without proper lease protections, such as a “Gross-Up” clause, the tenant will face significant rent increases simply because the landlord was successful in leasing the rest of the building. A sophisticated new lease negotiation must ensure the base year is adjusted to reflect a fully occupied building, creating a “realistic base year” that prevents unfair spikes in the second year and beyond.

Operating Expenses: The Anatomy of “Additional Rent”
To manage a large-scale portfolio, one must look beyond the total sum and analyze the components of building operating expenses. These generally include:
- Property Taxes: Often the largest and most volatile uncontrollable expense.
- Insurance: Subject to global market shifts and climate-related adjustments.
- Common Area Maintenance (CAM): The costs of operating shared lobbies, elevators, and parking structures.
- Property Management Fees: Usually calculated as a percentage of gross revenue.
In a full service lease, the tenant benefits from the landlord’s management of these services, but they assume the risk of any operating costs that exceed the specified expense stop. This can lead to significant, unexpected increases in total rent.
Conversely, in a net lease, the tenant pays their pro rata share of all expenses from day one. While a net lease offers more transparency, the gross lease with an expense stop is often preferred by large corporations for the initial budget certainty it provides, provided the base year stop is negotiated aggressively.
Commercial Real Estate Portfolio Strategy: Mitigation and Negotiation
A Fortune 500 tenant must approach commercial real estate leases with a defensive mindset. Because the risk of unexpected increases in property expenses is transferred to the tenant—supporting the stability of the landlord’s investment—the tenant must negotiate counter-measures.
- Negotiating the Expense Cap: While the expense stop limits the landlord’s downside, a sophisticated tenant will negotiate for an “expense cap.” This is a secondary ceiling that limits how much the tenant’s pro rata share can increase year-over-year. For example, capping annual increases on controllable operating expenses (like landscaping or security) at 5% ensures that the landlord has an incentive to manage the property efficiently.
- The Power of Audit Rights: Many tenants fail to exercise their right to verify actual expenses. Tenants should negotiate robust audit rights to ensure accuracy in the landlord’s operating expense statements. Requesting an annual audit prevents the landlord from passing through capital expenditures (which should be the landlord’s cost) as common area maintenance.
- Understanding the Base Year Lease vs. Expense Stop Amount: It is a common misconception that all commercial leases handle increases the same way. In a base year lease, the tenant is responsible for any increase in operating expenses over the actual expenses of the first year. In a lease with a fixed expense stop amount, the dollar figure is hard-coded (e.g., $10.00/SF). If the building’s actual expenses in the first year are already $11.00/SF, the tenant is effectively paying overages from the moment they move in.
Common Area Maintenance: The Friction Point
The common area maintenance (CAM) section of a lease is where most disputes arise. For a large-scale office building, CAM includes everything from HVAC maintenance to the flowers in the lobby.

Sophisticated tenants must scrutinize the definition of CAM to exclude:
- Executive salaries of the landlord’s personnel.
- Marketing costs for vacant spaces.
- Costs associated with other specific tenants’ modified gross leases.
- Taxes and insurance that should be itemized separately to ensure they are not being marked up by management fees.
By tightening these definitions, the tenant ensures that the difference they pay between the actual expenses and the base year stop represents legitimate, market-rate increases rather than landlord inefficiencies.
From Strategy to Execution: Optimizing with REoptimizer®
The most critical insight for a C-suite executive is that an expense stop is not a static figure; it is a dynamic risk that requires continuous monitoring. For organizations managing a high-volume, large-scale portfolio, manual tracking in spreadsheets is an invitation for budget leakage and missed audit windows.
To turn real estate from a passive expense into a strategic asset, forward-thinking tenants leverage REoptimizer®, a cloud-based transaction and lease management platform designed specifically for corporate tenants.
How REoptimizer® Protects Your Bottom Line:
- Centralized Expense Clarity: REoptimizer® acts as a single source of truth, centralizing all lease documents and abstracting critical data points like your base year stop, expense caps, and audit rights.
- Automated Anomaly Detection: The software provides instant visibility into overspending. By benchmarking your actual operating expenses against market data and previous years, REoptimizer® identifies red flags—such as “spiking” variable costs or miscalculated pro rata shares—before they become permanent losses.
- Audit Readiness: When it’s time to exercise your audit rights, REoptimizer® ensures you have the historical data and line-item clarity needed to hold landlords accountable, ensuring you aren’t paying for capital improvements or non-allowable CAM charges.
- Strategic Decision Support: Using interactive dashboards and AI-powered data mapping, REoptimizer® allows you to simulate “what-if” scenarios. You can see the long-term impact of rising property taxes or inflation on your entire portfolio’s occupancy costs years in advance.
Take Control of Your Portfolio Today
Don’t leave your corporate real estate budget to chance or landlord-favorable estimates. Whether you are negotiating a new high-rise lease or auditing a global portfolio, the right technology is your best defense.
Ready to see what you should be paying?
Schedule a Demo of REoptimizer® today to discover how our patented technology can identify inefficiencies, lower your CRE spend, and provide the transparency your C-suite demands.
Book a Demo
A lease is more than just a contract for space; it is a multi-million dollar bet on your landlord’s financial stability. Whether you are managing a global warehouse network or a large-scale office portfolio, your operational continuity depends on the person across the table. And in today’s volatile market, the most critical “inspection” isn’t of the brick and mortar—it’s of the debt service coverage ratio (DSCR).
If your landlord is facing financial strain, your “Class A” experience can quickly dissolve into deferred maintenance, tax liens, or even the nightmare of a mortgage loan foreclosure. Here is how sophisticated real estate investors and corporate tenants use DSCR to protect their interests and why REoptimizer® is the essential tool for flagging these risks before they become your problem.

What is DSCR (Debt Service Coverage Ratio)?
The Debt Service Coverage Ratio (DSCR) is a financial metric used by many lenders to determine a borrower’s capacity to repay a loan. In simple terms, DSCR measures whether the property generates enough cash flow to cover loan payments.
For a tenant, the landlord’s DSCR is a barometer for their ability to maintain the property. If the ratio is too low, the landlord is likely “robbing Peter to pay Paul”—diverting your monthly rent to cover current debt obligations instead of essential operating expenses.
How to Calculate DSCR
To calculate DSCR, you divide the property’s net operating income (NOI) by its total debt service:
DSCR=Total Debt ServiceNet Operating Income (NOI)
- Net Operating Income (NOI): This is the rental income minus operating expenses (such as taxes, insurance, and maintenance).
- Total Debt Service: This includes all principal and interest payments on the mortgage loan.
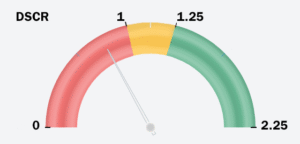
Benchmarks: What is an “Acceptable DSCR”?
Understanding the numbers is the first step in identifying financial difficulties in your landlord’s portfolio.
- DSCR > 1.25: This is the common industry standard for most real estate investors. It means the property generates 25% more income than is needed to cover loan payments.
- DSCR = 1.0: The property is just breaking even. One major vacancy or a spike in the annual interest rate could push the property into the red.
- DSCR < 1.0: A low DSCR indicates that the rental property’s cash flow is insufficient to cover mortgage payments.
The “Office Trap”: Why Office Tenants Face Higher Risk
For the office sector, a standard 1.25x DSCR is a starting point. Because office buildings have high tenant concentration and massive down payments required for tenant improvements (TIs), lenders often demand a minimum DSCR of 1.35x to 1.40x to approve an office mortgage loan.
The NOI Cash Flow Crisis
In the office world, Net Operating Income (NOI) is under siege. Unlike warehouse spaces with triple-net (NNN) leases that pass most costs to the tenant, office landlords often bear the brunt of:
- Skyrocketing Insurance Premiums: Insurance is a primary operating expense that has jumped 20–40% in some urban markets.
- Capital Expenditure (CapEx) vs. NOI: Standard DSCR calculation methods often exclude CapEx. However, an office landlord must spend heavily on lobbies and “amenitization” to attract tenants. If they are spending their cash on debt instead of CapEx, your building is effectively “dying on the vine.”
The Danger of Cross-Collateralization with a DSCR Loan
This is the “invisible” threat for a corporate tenant. Many large-scale office landlords use cross-collateralization, where multiple properties serve as collateral for a single mortgage loan (often called a blanket mortgage).
- The Scenario: Your office building might have a “healthy” individual DSCR of 1.30x.
- The Risk: If your landlord’s warehouse in another state loses its anchor tenant and its DSCR drops to 0.80x, the lender can trigger a cross-default.
- The Result: The lender could seize your building even if its performance is perfect. This “portfolio contagion” is why you must look beyond the single asset to the borrower’s capacity across their entire holdings.

Strategic Management: How to Audit Your Landlord
While you may not always have access to a landlord’s private tax returns, you can use the following factors to estimate their DSCR calculation:
- Analyze Market Rents: Use monthly rental income data for the property’s location to estimate the revenue.
- Monitor Tenant Turnover: If an office building has 20% of its leases expiring in the same period, the NOI is at extreme risk, which will tank the DSCR.
- Review Loan Terms: Research when the property was purchased. Loans from 2021 with low interest rates are now facing “refinancing cliffs” where the new annual interest rate will double the monthly payments.
Don’t Let Their Debt Become Your Disaster
In the current market, a strong DSCR is the ultimate sign of a reliable landlord. As a corporate tenant, you have the responsibility to understand the financial health of the entities housing your operations.
Are you ready to see the hidden risks in your CRE portfolio?
Stop guessing and start optimizing. REoptimizer® is the only transaction management software built to give corporate tenants an “institutional-grade” look at their landlords’ financial health. We don’t just help you manage leases; we help you audit the entities behind them.
Why REoptimizer® is Your Ultimate Shield:
- The Landlord Watchlist: Our platform flags landlords who are under financial strain based on real-time market data, debt maturity “cliffs,” and historical performance.
- Red & Yellow Flag Alerts: Instantly see which properties in your portfolio have a low DSCR or rising operating expenses that could trigger a service lapse.
- Cross-Collateralization Mapping: We reveal the hidden links in your landlord’s debt. If your warehouse is cross-collateralized with a failing office tower, REoptimizer® puts that risk on your dashboard before the lender sends a default notice.
- NOI Stress Testing: See how your building’s Net Operating Income holds up against shifting interest rates and inflation, giving you a clear picture of your borrower’s capacity.
Contact REoptimizer® today for a free portfolio health check. See exactly how our software can identify cross-default risks, flag high-risk debt obligations, and save you millions in hidden operational disruptions. Book a demo to see the difference it can have on your portfolio today.
Frequently Asked Questions: Navigating Landlord DSCR Risk
For corporate tenants, the financial health of a landlord is just as important as the physical health of the building. Below are the most common questions regarding the debt service coverage ratio and how it impacts your investment decisions.
How do you use the DSCR formula for a commercial landlord?
To perform a dscr calculation on a potential landlord, you need to estimate the building’s Net Operating Income (NOI) and divide it by the total debt service. While you may not have their exact ledger, you can use a dscr calculator approach by researching:
- Revenue: Estimated monthly rental income based on the building’s square footage and current market rates for the property’s location.
- Expenses: Standard operating expenses (usually 25–35% of gross income for office/warehouse) including taxes, insurance, and maintenance.
- Debt: Estimated principal and interest payments based on the property’s last recorded loan amount and the prevailing interest rate at the time of financing.
What is considered an acceptable DSCR for office vs. warehouse properties?
While many lenders accept a minimum DSCR of 1.25x for general investment property, the “safety zone” varies by asset class:
- Warehouse/Industrial: Because these often have stable, long-term NNN leases, a ratio of 1.20x to 1.25x is typically an acceptable DSCR.
- Office Space: Due to higher tenant turnover and the massive down payment required for tenant improvements (TIs), savvy tenants look for a landlord with a DSCR of 1.35x or higher. Anything lower suggests the landlord may lack the liquidity to fund your next office build-out.
How does a high interest rate impact a landlord’s debt service?
The annual interest rate is the most volatile component of the dscr formula. If a landlord has a floating-rate mortgage loan or an upcoming “refinancing cliff,” a 2% jump in the interest rate can instantly drop a healthy 1.30x DSCR to a sub-1.0 financial strain level. This is why REoptimizer® tracks market cycles—to warn you when your landlord’s borrower’s capacity is shrinking.
Can I use a DSCR loan calculator to estimate landlord risk?
Yes. A dscr loan calculator is a great “reverse engineering” tool. By inputting the property’s estimated value and the current loan to value (LTV) ratios, you can determine the maximum debt service the property can handle. If the resulting monthly payments are nearly equal to the estimated monthly rent, the landlord has zero margin for error.
What are the “other factors” that can tank a property’s DSCR?
Beyond the basic dscr calculation, tenants should watch for:
- Cross-Collateralization: If your office building is tied to a struggling retail mall in the same mortgage loan pool.
- Soft Market Conditions: Rising vacancy rates in the same period that expenses like insurance and taxes are increasing.
- Capital Expenditures: One-time costs (like a roof replacement) that aren’t in the NOI but drain the cash needed to repay the loan.
Proactive Portfolio Protection
In the high-stakes world of corporate CRE, information is your only shield. Don’t wait for a “For Sale” sign or a lapse in building services to realize your landlord is in trouble.
REoptimizer® gives you the data-driven edge to:
- Flag High-Risk Landlords: Identify owners with low DSCR and heavy debt obligations.
- Optimize Deal Terms: Use landlord financial weakness as leverage for better lease protections.
- Centralize Portfolio Health: See all your office and warehouse risks in one interactive dashboard.
As we look at the data from early 2026, a clear paradox has emerged: Office utilization is surging, yet global occupancy is technically over capacity.
In plain English, this means that while people are finally using the office again, companies have shrunk their real estate so much that the math no longer adds up on a Tuesday morning.
The office isn’t empty anymore, but it’s also not “back to normal.” It’s being hyper-optimized. Companies are trying to fit more employees into less office space to save costs, but they are hitting a new roadblock: a “capacity wall” that is starting to hurt employee satisfaction.
So let’s explore the data-driven reality of the return to office mandate, the impact on employee satisfaction, and how senior leaders are utilizing advanced transaction management software to navigate the “density squeeze.”

The Returning to Office Paradox
According to the latest 2026 reports, office building utilization reached 53% in 2025—a massive leap from the 35% seen just two years prior.
On the surface, this suggests that the return to the office is working. However, the underlying data reveals a significant friction point for many organizations.
Peak Days, Employee Satisfaction, and the Capacity Wall
For senior leaders, this presents a dual-headed monster: How do you enforce an office return when the office is physically too small for a full return?
Remember over half of the world’s largest organizations right-sized their footprints in a post-covid working environment. We’re dealing with the next leg of a pandemic readjustment.
1. The 111% Rule: The “Oversold Flight” Strategy
Think of this like an airline that sells 111 tickets for a plane with only 100 seats. They do this because, historically, someone always misses their flight.
- The Strategy: Many organizations have realized that with a hybrid work policy, having a 1:1 desk-to-employee ratio is a waste of capital. By allocating 111% of their workforce to a physical location, they are betting that on any given day, at least 11% of people will be working remotely, on vacation, or out at meetings.
- The Reality: This works perfectly on a Monday or Friday. But the moment a return to office mandate forces a “All Hands” meeting on a Wednesday, the “flight” is overbooked.
- The Consequence: This is where “Coffee Badging” (showing up just to be seen) turns into “Floor Wandering.” If employees can’t find a place to sit within ten minutes, job satisfaction plummets and they head back to their own home.
2. The Squeeze: Efficiency vs. The “Human Radius”
In the “old days,” we had a “buffer zone” of personal space. That buffer is officially gone.
- The Strategy: By tightening design density to 190 square feet per seat, employers are maximizing the yield of their workplace. It looks great on a spreadsheet because it lowers the “cost per head.”
- The Reality: Humans aren’t just data points. When you pack people this tightly, you hit capacity pressure. This isn’t just about elbow room; it’s about acoustics.
- The Consequence: Without the luxury of “dead space” to absorb sound, the office becomes a cacophony of Zoom calls and chatter. Heads down work and quiet time become impossible. The very collaboration that senior leaders want actually suffers because the environment is too overstimulating for deep thought.
3. The Tuesday-Thursday Peak: The “Mid-Week Bottleneck”
If utilization were spread evenly across five days, a 53% average would be a dream for organizations. But work culture doesn’t move in a straight line; it moves in a bell curve.
- The Strategy: Most hybrid work models allow for flexible work, which inevitably leads to many workers choosing the same specific days (Tuesday, Wednesday, and Thursday) to be in office.
- The Reality: While the weekly average is manageable, the peak utilization hits 80%. This is significantly higher than the 65% target—the “Goldilocks Zone” where a building feels vibrant but not crowded.
- The Consequence: At 80% utilization, every “extra” amenity breaks. The elevators take longer, the gym is packed, and the “hot desking” app shows zero availability by 9:15 AM.
The Remote Work Generational Divide
The remote and hybrid work debate is no longer a monolith. By 2026, the data shows that job satisfaction is tied directly to how leaders manage the flexible work spectrum.
Hybrid Work Priorities by Generation
| Demographic | Preference | Key Factor |
| Gen Z | In-Person Work | Mentorship and collaboration. |
| Millennials | Hybrid Approach | Better work-life balance and childcare. |
| Baby Boomers | Office Work | Traditional management practices and structure. |
Recent surveys indicate that most employees (84%) feel more productive in a hybrid work setting. However, rto mandates are often seen as “passive layoffs.” In fact, 25% of executives recently admitted they hoped a return to office mandate would trigger voluntary departures.
“The mandates aren’t filling offices; they’re just losing talent. High-performing employees are 16% more likely to leave when facing a rigid mandate.” — 2026 Workplace Research
The Industrial Pivot: Warehouse vs. Office
For tenants with mixed portfolios, the federal workforce trends and private sector office mandates are only half the story. The “Infill Industrial” movement of 2026 has made warehouse space as scrutinized as the office.
- The Micro-Fulfillment Shift: Many organizations are now subdividing massive, 500,000-square-foot “big box” sites into smaller, multi-tenant nodes. Why? To accommodate last-mile delivery needs that require being closer to the consumer’s own home.
- Power and Automation: By 2026, the key factors for warehouse selection have shifted from mere square footage to power availability. As e-commerce giants and major companies integrate AI-driven robotics, a facility’s ability to support high-density automation is the new gold standard for performance.
- The Flexible Lease: Following the hybrid work trend, industrial tenants are increasingly offering flexibility in their own portfolios—moving away from 10-year commitments toward “elastic” short-term arrangements that allow them to scale as workers and demand fluctuate.
The Hub-and-Spoke Reality: Beyond the Central HQ
The traditional “Central HQ” is being replaced by a more agile hub-and-spoke model. Many workers and managers have realized that a long commute to a downtown office is the primary killer of employee satisfaction.
- Regional Strength: We have seen a 20% rise in interest for suburban and regional hubs that combine office work and logistics in a single “flex” location.
- The Commute Factor: By placing “Spoke” offices near regional warehouse clusters, employers are successfully bridging the gap between in-person work and better work-life balance.
- Data-Driven Placement: Leaders are now using research and recent surveys to place these hubs in “talent-rich” suburbs where Gen Z and Baby Boomers actually live, effectively reducing “commute friction” while maintaining collaboration.
The 2026 Insight: For the modern business, the goal is no longer a full office return to a single point on a map. It’s about building a workplace network that is as fast and flexible as the supply chain itself.

Critical Factors for Portfolio Optimization
To manage this complexity, employers are focusing on portfolio optimization as a top priority. The primary driver is a plan for contraction—expecting to need less space due to working remotely part of the week.
Data-Driven Decision Making for Remote and Hybrid Work
- Desk Sharing Ratios: 69% of organizations now utilize desk sharing. The sweet spot for performance is currently 1.01–1.49 people per seat.
- Specific Days: Successful managers are letting teams decide their own in office days (e.g., three days a week) rather than a top-down week starting Monday mandate.
- Noise & Technology: Investment in noise reduction and collaboration tech is crucial to keep employees from fleeing back to their own home for “real work.”
Optimization Through Transaction Intelligence
In the high-stakes environment of 2026, “gut feeling” real estate decisions aren’t just risky—they are a liability to the bottom line. Organizational health now depends on key insights that bridge the gap between remote work benefits and the logistical necessity of in-person work.
REoptimizer® is the definitive transaction management software for corporate tenants navigating the “111% occupancy puzzle.” Whether you are orchestrating a full office return for a massive federal workforce or fine-tuning a hybrid work policy for a global company, our platform transforms raw data into a competitive advantage.
Why REoptimizer® is Critical for the 2026 Portfolio:
- Precision Deal Optimization: Stop overpaying for underutilized square footage. Ensure every lease—from high-rise office towers to last-mile warehouse hubs—is data-driven and aligned with actual workforce attendance.
- True Portfolio Transparency: Gain a real-time view of where your workers are actually productive and where your space is being wasted. Identify the “density squeeze” before it impacts employee satisfaction.
- Agile Transaction Management: Streamline the complex practice of disposing of redundant assets, subletting mid-week “ghost zones,” or rapidly acquiring regional hubs to accommodate flexible work growth.
- Performance Benchmarking: Use research-backed metrics to compare your workplace efficiency against industry standards, ensuring your senior leaders are making moves that support long-term productivity.
Don’t Manage the Future with Yesterday’s Spreadsheets
The future of business belongs to organizations that treat their real estate as a dynamic asset, not a fixed cost. REoptimizer® gives leaders the tools to explore new opportunities, optimize specific days, and ensure that every person in the team has the right space at the right time. See the difference it can make in your portfolio today.
Book a Demo
